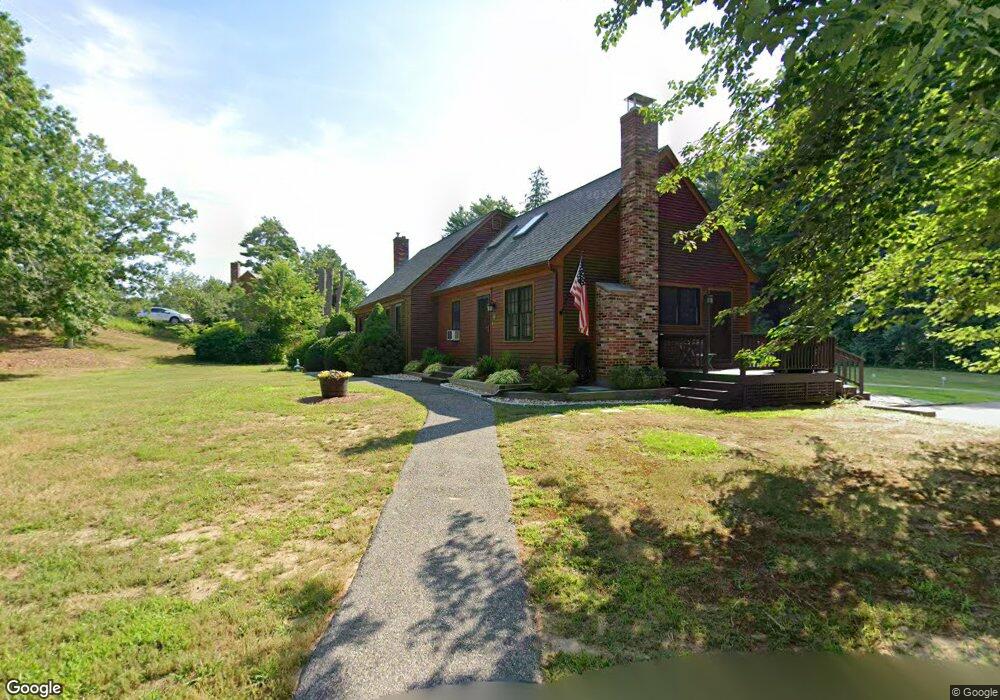
22 Packet Landing Unit A Pembroke, MA 02359
Estimated Value: $454,000 - $528,000
2
Beds
2
Baths
1,200
Sq Ft
$403/Sq Ft
Est. Value
About This Home
This home is located at 22 Packet Landing Unit A, Pembroke, MA 02359 and is currently estimated at $483,162, approximately $402 per square foot. 22 Packet Landing Unit A is a home located in Plymouth County with nearby schools including Pembroke High School, Cadence Academy Preschool - Hanover, and Cardinal Cushing Centers.
Ownership History
Date
Name
Owned For
Owner Type
Purchase Details
Closed on
May 8, 2015
Sold by
Mainini Maria
Bought by
Edson Judith
Current Estimated Value
Home Financials for this Owner
Home Financials are based on the most recent Mortgage that was taken out on this home.
Original Mortgage
$209,550
Outstanding Balance
$161,488
Interest Rate
3.69%
Mortgage Type
New Conventional
Estimated Equity
$321,674
Purchase Details
Closed on
Feb 20, 2015
Sold by
Morton Christopher M and Jp Morgan Chase Bank N
Bought by
Mainini Maria
Home Financials for this Owner
Home Financials are based on the most recent Mortgage that was taken out on this home.
Original Mortgage
$169,000
Interest Rate
3.74%
Mortgage Type
New Conventional
Purchase Details
Closed on
Oct 16, 2006
Sold by
Veterans Dev Corp
Bought by
Morton Christopher M
Purchase Details
Closed on
Sep 28, 2001
Sold by
Fay Michael P and Fay Julia A
Bought by
Morton Christopher M
Create a Home Valuation Report for This Property
The Home Valuation Report is an in-depth analysis detailing your home's value as well as a comparison with similar homes in the area
Home Values in the Area
Average Home Value in this Area
Purchase History
| Date | Buyer | Sale Price | Title Company |
|---|---|---|---|
| Edson Judith | $229,000 | -- | |
| Mainini Maria | $169,000 | -- | |
| Morton Christopher M | -- | -- | |
| Morton Christopher M | $233,000 | -- |
Source: Public Records
Mortgage History
| Date | Status | Borrower | Loan Amount |
|---|---|---|---|
| Open | Edson Judith | $209,550 | |
| Previous Owner | Mainini Maria | $169,000 | |
| Previous Owner | Morton Christopher M | $298,848 | |
| Previous Owner | Morton Christopher M | $294,432 | |
| Previous Owner | Morton Christopher M | $290,081 |
Source: Public Records
Tax History Compared to Growth
Tax History
| Year | Tax Paid | Tax Assessment Tax Assessment Total Assessment is a certain percentage of the fair market value that is determined by local assessors to be the total taxable value of land and additions on the property. | Land | Improvement |
|---|---|---|---|---|
| 2025 | $4,625 | $384,800 | $0 | $384,800 |
| 2024 | $4,444 | $369,400 | $0 | $369,400 |
| 2023 | $4,435 | $348,700 | $0 | $348,700 |
| 2022 | $4,481 | $316,700 | $0 | $316,700 |
| 2021 | $4,104 | $281,500 | $0 | $281,500 |
| 2020 | $4,285 | $295,700 | $0 | $295,700 |
| 2019 | $4,041 | $276,800 | $0 | $276,800 |
| 2018 | $3,739 | $251,100 | $0 | $251,100 |
| 2017 | $3,669 | $243,000 | $0 | $243,000 |
| 2016 | $3,200 | $209,700 | $0 | $209,700 |
| 2015 | -- | $213,400 | $0 | $213,400 |
Source: Public Records
Map
Nearby Homes
- 218 Schoosett St
- 21 Union St
- 21 Chowdermarch St
- 5 Royal Dane Dr Unit 46
- 5 Royal Dane Dr Unit 45
- 10 Penstock Ln
- 451 School St Unit 5-2
- 451 School St Unit 3-4
- 55 Shipyard Ln
- 172 Washington St
- 261 Washington St
- 34 Canonchet Trail
- 20 Meadow Brook Rd
- 10 Shrine Rd
- 26 Church St
- 56 Wiltshire Ln
- 33 Barker Square Dr Unit 33
- 899 Old Main Street Extension
- 330 Pleasant St
- 2 Proprietors Dr Unit 23
- 22 Packet Landing Unit B
- 22 Packet Landing Unit 6
- 22 Packet Landing Unit 22B
- 22 Packet Landing Unit 22A
- 16 Packet Landing Unit B
- 16 Packet Landing Unit A
- 16 Packet Landing Unit 16B
- 28 Packet Landing Unit B
- 28 Packet Landing Unit A
- 28 Packet Landing Unit 8-B
- 24 Packet Landing Unit B
- 24 Packet Landing Unit A
- 24A Packet Landing Unit A
- 19 Packet Landing Unit B
- 19 Packet Landing Unit A
- 19 Packet Landing
- 19 Packet Landing Unit 19A
- 337 Water St
- 25A Packet Landing Unit 25A
- 25 Packet Landing Unit B