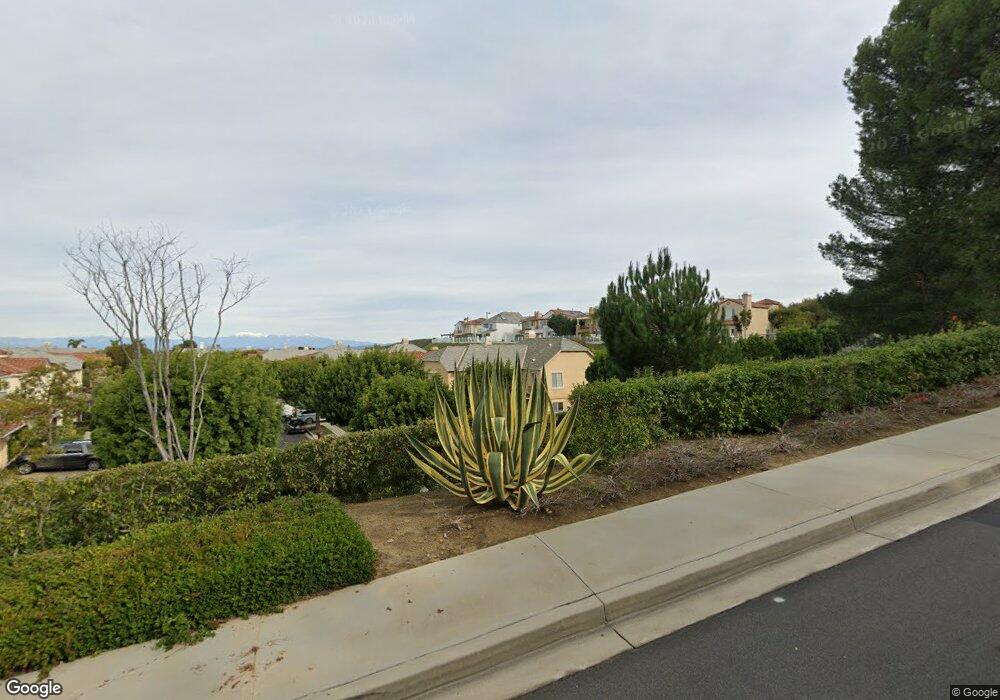
22 Pavona Newport Coast, CA 92657
Newport Coast NeighborhoodEstimated Value: $3,264,000 - $4,448,000
3
Beds
3
Baths
2,584
Sq Ft
$1,568/Sq Ft
Est. Value
About This Home
This home is located at 22 Pavona, Newport Coast, CA 92657 and is currently estimated at $4,052,940, approximately $1,568 per square foot. 22 Pavona is a home located in Orange County with nearby schools including Newport Coast Elementary School, Corona del Mar Middle and High School, and Harbor Day School.
Ownership History
Date
Name
Owned For
Owner Type
Purchase Details
Closed on
Mar 31, 1998
Sold by
Irvine Community Development Company
Bought by
Man Georgina Ching To
Current Estimated Value
Home Financials for this Owner
Home Financials are based on the most recent Mortgage that was taken out on this home.
Original Mortgage
$409,000
Interest Rate
6.25%
Create a Home Valuation Report for This Property
The Home Valuation Report is an in-depth analysis detailing your home's value as well as a comparison with similar homes in the area
Home Values in the Area
Average Home Value in this Area
Purchase History
| Date | Buyer | Sale Price | Title Company |
|---|---|---|---|
| Man Georgina Ching To | $511,500 | First American Title Ins Co |
Source: Public Records
Mortgage History
| Date | Status | Borrower | Loan Amount |
|---|---|---|---|
| Previous Owner | Man Georgina Ching To | $409,000 |
Source: Public Records
Tax History Compared to Growth
Tax History
| Year | Tax Paid | Tax Assessment Tax Assessment Total Assessment is a certain percentage of the fair market value that is determined by local assessors to be the total taxable value of land and additions on the property. | Land | Improvement |
|---|---|---|---|---|
| 2025 | $8,693 | $801,407 | $393,618 | $407,789 |
| 2024 | $8,693 | $785,694 | $385,900 | $399,794 |
| 2023 | $8,565 | $770,289 | $378,334 | $391,955 |
| 2022 | $8,416 | $755,186 | $370,916 | $384,270 |
| 2021 | $7,928 | $740,379 | $363,643 | $376,736 |
| 2020 | $8,284 | $732,788 | $359,914 | $372,874 |
| 2019 | $8,306 | $718,420 | $352,857 | $365,563 |
| 2018 | $8,150 | $704,334 | $345,938 | $358,396 |
| 2017 | $8,291 | $690,524 | $339,155 | $351,369 |
| 2016 | $9,971 | $676,985 | $332,505 | $344,480 |
| 2015 | $9,918 | $666,817 | $327,511 | $339,306 |
| 2014 | $9,682 | $653,755 | $321,095 | $332,660 |
Source: Public Records
Map
Nearby Homes