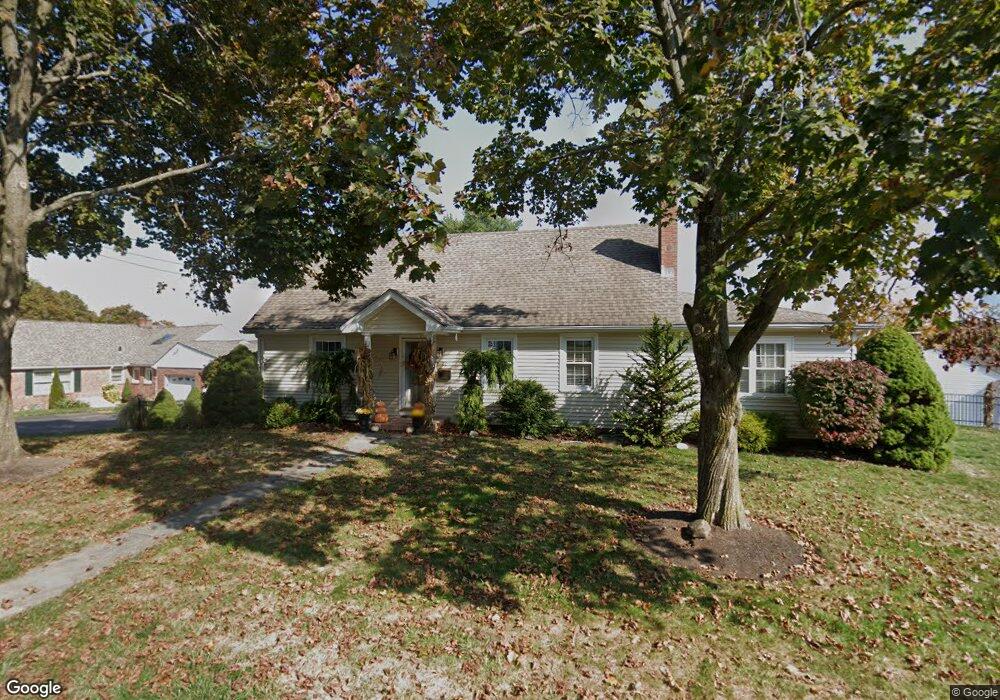
22 Peck Rd Middletown, CT 06457
Estimated Value: $353,000 - $419,000
4
Beds
2
Baths
2,037
Sq Ft
$191/Sq Ft
Est. Value
About This Home
This home is located at 22 Peck Rd, Middletown, CT 06457 and is currently estimated at $388,868, approximately $190 per square foot. 22 Peck Rd is a home located in Middlesex County with nearby schools including Farm Hill School, Middletown High School, and St John Paul II School.
Ownership History
Date
Name
Owned For
Owner Type
Purchase Details
Closed on
Apr 23, 1999
Sold by
Hartman Jeanne P
Bought by
Marchese Maryellen and Consentino Sergio
Current Estimated Value
Home Financials for this Owner
Home Financials are based on the most recent Mortgage that was taken out on this home.
Original Mortgage
$109,100
Interest Rate
6.88%
Create a Home Valuation Report for This Property
The Home Valuation Report is an in-depth analysis detailing your home's value as well as a comparison with similar homes in the area
Purchase History
| Date | Buyer | Sale Price | Title Company |
|---|---|---|---|
| Marchese Maryellen | $114,900 | -- |
Source: Public Records
Mortgage History
| Date | Status | Borrower | Loan Amount |
|---|---|---|---|
| Closed | Marchese Maryellen | $175,000 | |
| Closed | Marchese Maryellen | $35,000 | |
| Closed | Marchese Maryellen | $109,100 |
Source: Public Records
Tax History
| Year | Tax Paid | Tax Assessment Tax Assessment Total Assessment is a certain percentage of the fair market value that is determined by local assessors to be the total taxable value of land and additions on the property. | Land | Improvement |
|---|---|---|---|---|
| 2025 | $8,359 | $225,850 | $65,270 | $160,580 |
| 2024 | $7,998 | $225,850 | $65,270 | $160,580 |
| 2023 | $7,591 | $225,850 | $65,270 | $160,580 |
| 2022 | $6,943 | $168,300 | $43,510 | $124,790 |
| 2021 | $6,913 | $168,300 | $43,510 | $124,790 |
| 2020 | $6,901 | $168,300 | $43,510 | $124,790 |
| 2019 | $6,934 | $168,300 | $43,510 | $124,790 |
| 2018 | $6,695 | $168,300 | $43,510 | $124,790 |
| 2017 | $6,297 | $162,790 | $50,550 | $112,240 |
| 2016 | $6,171 | $162,790 | $50,550 | $112,240 |
| 2015 | $6,034 | $162,790 | $50,550 | $112,240 |
| 2014 | $6,028 | $162,790 | $50,550 | $112,240 |
Source: Public Records
Map
Nearby Homes
- 63 Millbrook Rd
- 1 Jefferson Ave
- 50 Cedar St
- 6 Hillside Ct
- 6 Bidwell Terrace
- 909 Randolph Rd
- 58 Durant Terrace
- 42 Saybrook Rd
- 5 Wall St
- 37 Dobson Cir
- 28 Kent Ct
- 180 Randolph Rd
- 11 Mansfield Terrace
- 208 Highmeadow Ln
- 8 Macdonough Place
- 70 Jack English Dr
- 122 Baldwin Dr
- 111 Dekoven Dr Unit 506
- 201 College St Unit 26
- 678 Bartholomew Rd
Your Personal Tour Guide
Ask me questions while you tour the home.