Estimated Value: $670,000 - $1,442,000
1
Bed
1
Bath
600
Sq Ft
$1,720/Sq Ft
Est. Value
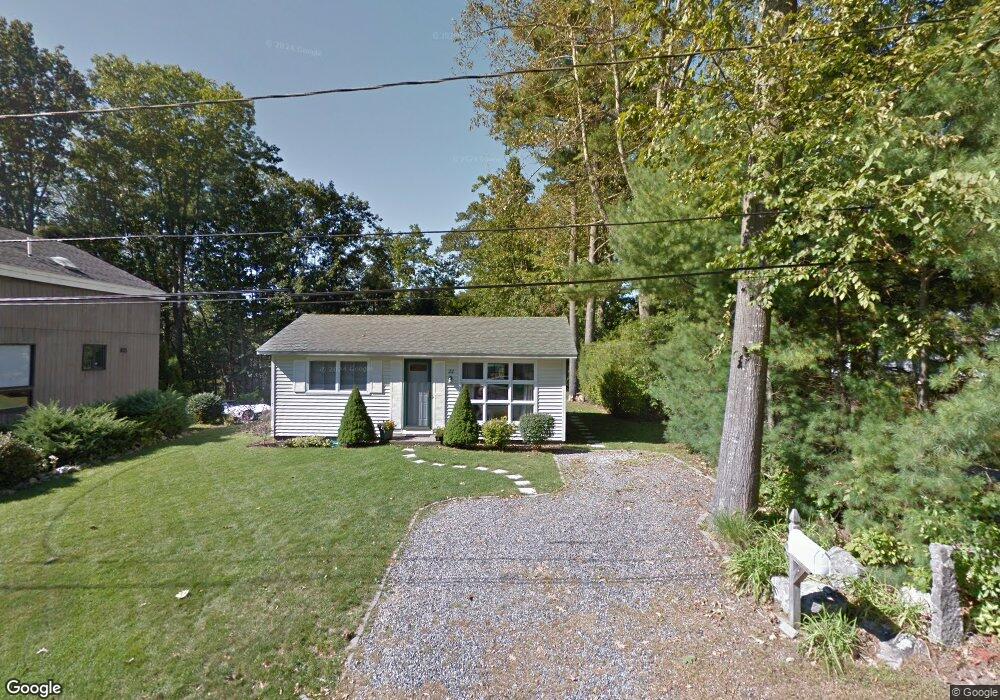
About This Home
This home is located at 22 Pine St, Rye, NH 03870 and is currently estimated at $1,032,283, approximately $1,720 per square foot. 22 Pine St is a home located in Rockingham County with nearby schools including Rye Elementary School, Rye Junior High School, and Rye Country Day School.
Ownership History
Date
Name
Owned For
Owner Type
Purchase Details
Closed on
Mar 14, 2025
Sold by
Cote Brian K and Schwandt Sara K
Bought by
Eel Pond Properties Llc
Current Estimated Value
Purchase Details
Closed on
Jan 30, 2025
Sold by
Cote Ft and Cote
Bought by
Cote Brian K and Schwardt Sara K
Purchase Details
Closed on
Oct 22, 2021
Sold by
Cote Ronald R and Cote Linda M
Bought by
Cote Ft and Cote
Purchase Details
Closed on
Dec 1, 2000
Sold by
Clark John R
Bought by
Cote Ronald R and Cote Linda M
Purchase Details
Closed on
Apr 3, 2000
Sold by
Coburn Robert E
Bought by
Clark John R
Home Financials for this Owner
Home Financials are based on the most recent Mortgage that was taken out on this home.
Original Mortgage
$123,750
Interest Rate
8.4%
Mortgage Type
Purchase Money Mortgage
Create a Home Valuation Report for This Property
The Home Valuation Report is an in-depth analysis detailing your home's value as well as a comparison with similar homes in the area
Home Values in the Area
Average Home Value in this Area
Purchase History
| Date | Buyer | Sale Price | Title Company |
|---|---|---|---|
| Eel Pond Properties Llc | -- | None Available | |
| Eel Pond Properties Llc | -- | None Available | |
| Cote Brian K | -- | None Available | |
| Cote Brian K | -- | None Available | |
| Cote Ft | -- | None Available | |
| Cote Ft | -- | None Available | |
| Cote Ronald R | $161,000 | -- | |
| Cote Ronald R | $161,000 | -- | |
| Clark John R | $137,500 | -- | |
| Clark John R | $137,500 | -- |
Source: Public Records
Mortgage History
| Date | Status | Borrower | Loan Amount |
|---|---|---|---|
| Previous Owner | Clark John R | $123,750 |
Source: Public Records
Tax History
| Year | Tax Paid | Tax Assessment Tax Assessment Total Assessment is a certain percentage of the fair market value that is determined by local assessors to be the total taxable value of land and additions on the property. | Land | Improvement |
|---|---|---|---|---|
| 2024 | $5,548 | $640,700 | $537,200 | $103,500 |
| 2023 | $5,145 | $640,700 | $537,200 | $103,500 |
| 2022 | $4,268 | $611,400 | $507,900 | $103,500 |
| 2021 | $4,009 | $392,300 | $323,800 | $68,500 |
| 2020 | $4,009 | $392,300 | $323,800 | $68,500 |
| 2019 | $4,009 | $392,300 | $323,800 | $68,500 |
| 2018 | $4,287 | $392,300 | $323,800 | $68,500 |
| 2017 | $3,966 | $392,300 | $323,800 | $68,500 |
| 2016 | $3,534 | $330,900 | $276,000 | $54,900 |
| 2013 | $3,630 | $330,900 | $276,000 | $54,900 |
Source: Public Records
Map
Nearby Homes
Your Personal Tour Guide
Ask me questions while you tour the home.