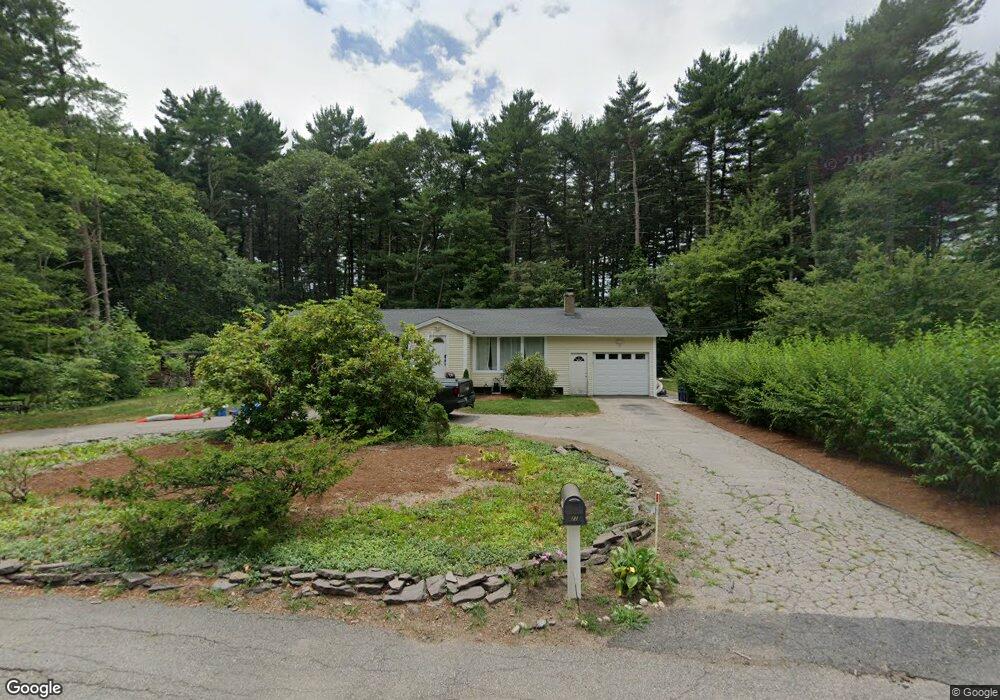
22 Pole Plain Rd Sharon, MA 02067
Estimated Value: $697,848 - $735,000
3
Beds
3
Baths
1,976
Sq Ft
$361/Sq Ft
Est. Value
About This Home
This home is located at 22 Pole Plain Rd, Sharon, MA 02067 and is currently estimated at $712,462, approximately $360 per square foot. 22 Pole Plain Rd is a home located in Norfolk County with nearby schools including Heights Elementary School, Sharon Middle School, and Sharon High School.
Ownership History
Date
Name
Owned For
Owner Type
Purchase Details
Closed on
Aug 18, 2016
Sold by
Vasilets Dmitry and Vasilets Evgenia
Bought by
Petukh Kirill and Khromey Anna
Current Estimated Value
Home Financials for this Owner
Home Financials are based on the most recent Mortgage that was taken out on this home.
Original Mortgage
$411,400
Outstanding Balance
$326,609
Interest Rate
3.41%
Mortgage Type
New Conventional
Estimated Equity
$385,853
Purchase Details
Closed on
Feb 26, 2009
Sold by
Stonegate 2 T
Bought by
Vasilets Dmitry
Home Financials for this Owner
Home Financials are based on the most recent Mortgage that was taken out on this home.
Original Mortgage
$247,000
Interest Rate
5%
Mortgage Type
Purchase Money Mortgage
Purchase Details
Closed on
Aug 30, 2007
Sold by
Wilson Robbin E and Option One Mortgage Co
Bought by
Schneider Michael K
Purchase Details
Closed on
Jun 21, 1993
Sold by
Sharon Cu
Bought by
Wilson Steven M and Wilson Robbin L
Purchase Details
Closed on
Jan 25, 1993
Sold by
Cohen Harry J and Sharon Cu
Bought by
Sharon Cu
Create a Home Valuation Report for This Property
The Home Valuation Report is an in-depth analysis detailing your home's value as well as a comparison with similar homes in the area
Home Values in the Area
Average Home Value in this Area
Purchase History
| Date | Buyer | Sale Price | Title Company |
|---|---|---|---|
| Petukh Kirill | $484,000 | -- | |
| Vasilets Dmitry | $260,000 | -- | |
| Schneider Michael K | $180,000 | -- | |
| Stonegate 2 T | -- | -- | |
| Schneider Michael K | $180,000 | -- | |
| Vasilets Dmitry | $260,000 | -- | |
| Stonegate 2 T | -- | -- | |
| Wilson Steven M | $130,000 | -- | |
| Sharon Cu | $100,000 | -- |
Source: Public Records
Mortgage History
| Date | Status | Borrower | Loan Amount |
|---|---|---|---|
| Open | Petukh Kirill | $411,400 | |
| Closed | Sharon Cu | $411,400 | |
| Previous Owner | Sharon Cu | $243,600 | |
| Previous Owner | Vasilets Dmitry | $247,000 |
Source: Public Records
Tax History
| Year | Tax Paid | Tax Assessment Tax Assessment Total Assessment is a certain percentage of the fair market value that is determined by local assessors to be the total taxable value of land and additions on the property. | Land | Improvement |
|---|---|---|---|---|
| 2025 | $9,354 | $535,100 | $366,100 | $169,000 |
| 2024 | $8,953 | $509,300 | $335,800 | $173,500 |
| 2023 | $8,758 | $471,100 | $313,900 | $157,200 |
| 2022 | $8,386 | $424,600 | $261,500 | $163,100 |
| 2021 | $8,284 | $405,500 | $246,800 | $158,700 |
| 2020 | $7,705 | $405,500 | $246,800 | $158,700 |
| 2019 | $7,145 | $368,100 | $218,300 | $149,800 |
| 2018 | $7,049 | $363,900 | $214,100 | $149,800 |
| 2017 | $6,865 | $349,900 | $200,100 | $149,800 |
| 2016 | $6,769 | $336,600 | $200,100 | $136,500 |
| 2015 | $6,248 | $307,800 | $183,600 | $124,200 |
| 2014 | $5,777 | $281,100 | $166,900 | $114,200 |
Source: Public Records
Map
Nearby Homes
- 111 E Foxboro St
- 174 E Foxboro St
- 2 Foxfire Dr
- 180 Old Post Rd Unit 202
- 180 Old Post Rd Unit 206
- 180 Old Post Rd Unit 308
- 180 Old Post Rd Unit 201
- 180 Old Post Rd Unit 405
- 180 Old Post Rd Unit 207
- 668 S Main St
- 22 Ames Ct
- 5 Trowel Pond Shop Rd Unit C
- 58 Ames St
- 277 Everett St
- 29 Station St
- 133 Ames St
- 132 Massapoag Ave
- 0 U S Route 1
- 15 Paul Revere Rd
- 3 Wampanoag Rd
- 16 Pole Plain Rd
- 24 Pole Plain Rd
- 17 Pole Plain Rd
- 21 Pole Plain Rd
- 14 Pole Plain Rd
- 23 Pole Plain Rd
- 8 Grant Cir
- 12 Pole Plain Rd
- 12 Grant Cir
- 4 Grant Cir
- 11 Pole Plain Rd
- 28 Pole Plain Rd
- 14 Grant Cir
- 25 Pole Plain Rd
- 10 Pole Plain Rd
- 16 Grant Cir
- 23 Walpole St Unit AR
- 23 Walpole St
- 6 Pole Plain Rd
- 15 Grant Cir
Your Personal Tour Guide
Ask me questions while you tour the home.