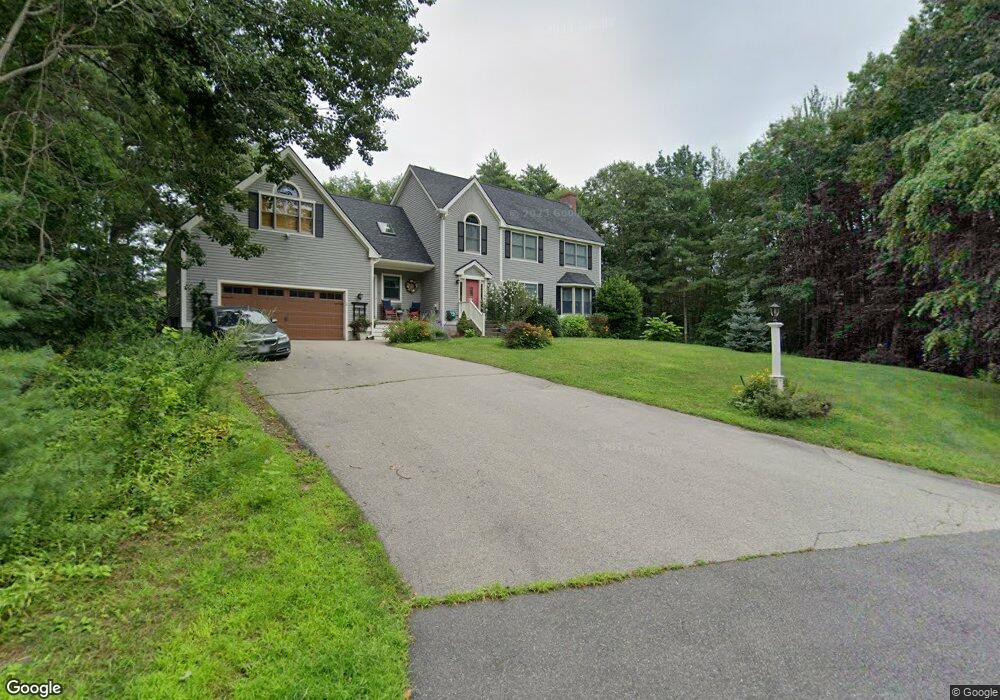
22 Rebecca Rd Ogunquit, ME 03907
Ogunquit NeighborhoodEstimated Value: $1,104,376 - $1,301,000
4
Beds
3
Baths
2,494
Sq Ft
$492/Sq Ft
Est. Value
About This Home
This home is located at 22 Rebecca Rd, Ogunquit, ME 03907 and is currently estimated at $1,227,344, approximately $492 per square foot. 22 Rebecca Rd is a home located in York County with nearby schools including Wells Junior High School, Wells Elementary School, and Wells High School.
Ownership History
Date
Name
Owned For
Owner Type
Purchase Details
Closed on
Feb 10, 2012
Sold by
Bonello Marie M and Bonello Frances A
Bought by
Dennis Beth A and Dennis Kevin M
Current Estimated Value
Home Financials for this Owner
Home Financials are based on the most recent Mortgage that was taken out on this home.
Original Mortgage
$315,000
Outstanding Balance
$216,530
Interest Rate
3.96%
Mortgage Type
New Conventional
Estimated Equity
$1,010,814
Purchase Details
Closed on
Sep 1, 2011
Sold by
Bonello Mario M
Bought by
Nationscredit Fin Svcs
Create a Home Valuation Report for This Property
The Home Valuation Report is an in-depth analysis detailing your home's value as well as a comparison with similar homes in the area
Home Values in the Area
Average Home Value in this Area
Purchase History
| Date | Buyer | Sale Price | Title Company |
|---|---|---|---|
| Dennis Beth A | -- | -- | |
| Nationscredit Fin Svcs | $313,316 | -- |
Source: Public Records
Mortgage History
| Date | Status | Borrower | Loan Amount |
|---|---|---|---|
| Open | Dennis Beth A | $315,000 |
Source: Public Records
Tax History
| Year | Tax Paid | Tax Assessment Tax Assessment Total Assessment is a certain percentage of the fair market value that is determined by local assessors to be the total taxable value of land and additions on the property. | Land | Improvement |
|---|---|---|---|---|
| 2024 | $4,939 | $764,500 | $315,700 | $448,800 |
| 2023 | $4,939 | $764,500 | $315,700 | $448,800 |
| 2022 | $4,832 | $764,500 | $315,700 | $448,800 |
| 2021 | $4,234 | $520,200 | $139,900 | $380,300 |
| 2020 | $4,162 | $520,200 | $139,900 | $380,300 |
| 2019 | $4,162 | $520,200 | $139,900 | $380,300 |
| 2018 | $4,115 | $520,200 | $139,900 | $380,300 |
| 2017 | $3,943 | $520,200 | $139,900 | $380,300 |
| 2016 | $4,563 | $564,000 | $189,800 | $374,200 |
| 2015 | $4,551 | $564,000 | $189,800 | $374,200 |
| 2014 | $4,377 | $564,000 | $189,800 | $374,200 |
Source: Public Records
Map
Nearby Homes
- 31 Rebecca Rd
- 22 Adams Ln
- 191 Tatnic Rd Unit 73
- 76 Post Rd Unit 17M
- 76 Post Rd Unit 18M
- 76 Post Rd Unit 8M
- 76 Post Rd Unit 17&18M
- 76 Post Rd Unit 21M
- 9 Bourne Ave Unit B6
- 488 Main St Unit 7
- 444 Main St Unit 112
- 473 Tatnic Rd
- 1 Old County Rd Unit 155
- 168 Ocean Ave
- 14 Valleybrook Rd Unit 14
- 47 Village Green Dr
- 141 Rabbit Run
- 412 Post Rd Unit 304
- 412 Post Rd Unit 145
- 25 Shore Rd Unit A
- 14 Rebecca Ln
- 47 Old King Hwy
- 47 Old Kings Hwy
- 30 Rebecca Rd
- 11 Rebecca Rd
- 27 Rebecca Rd
- 53 Old Kings Hwy
- 19 Rebecca Rd
- 46 Old Kings Hwy
- 46 Old Kings Hwy
- 25 Rebecca Rd
- 42 Old King Hwy
- 53 Old Kings Hwy
- 25 Old Kings Hwy
- 67 Old Kings Hwy
- 67 Old Kings Hwy
- 7 Rebecca Rd
- 80 Captain Thomas Rd
- 29 Rebecca Rd
- 28 Old King Hwy
Your Personal Tour Guide
Ask me questions while you tour the home.