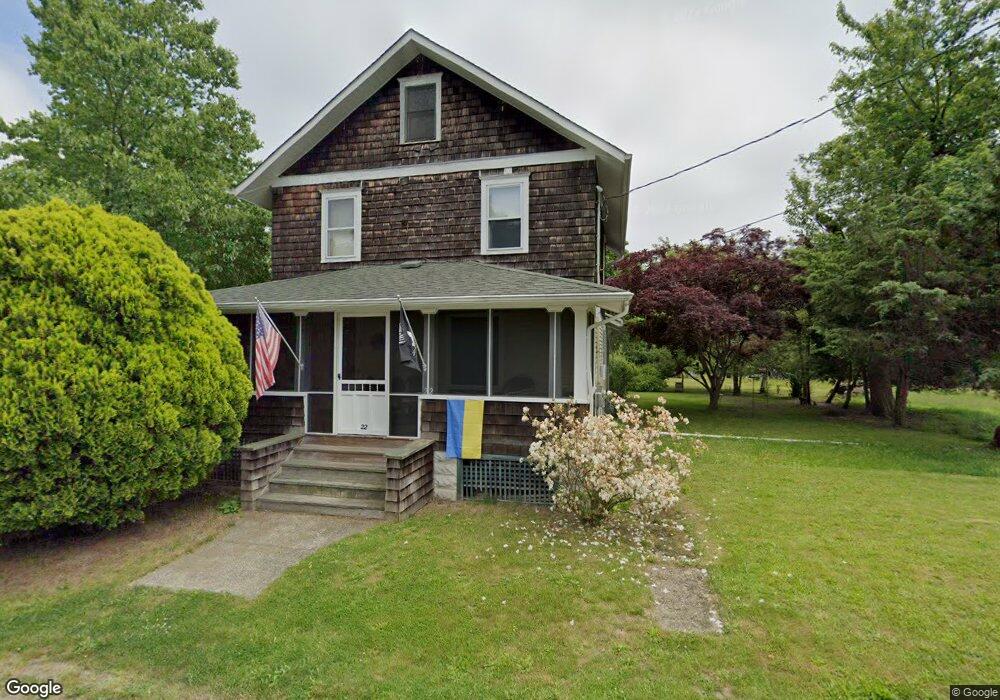
22 Ridgeway St Barnegat, NJ 08005
Barnegat Township NeighborhoodEstimated Value: $327,868 - $450,000
3
Beds
1
Bath
1,632
Sq Ft
$251/Sq Ft
Est. Value
About This Home
This home is located at 22 Ridgeway St, Barnegat, NJ 08005 and is currently estimated at $409,217, approximately $250 per square foot. 22 Ridgeway St is a home located in Ocean County with nearby schools including Barnegat High School.
Ownership History
Date
Name
Owned For
Owner Type
Purchase Details
Closed on
Aug 25, 2008
Current Estimated Value
Home Financials for this Owner
Home Financials are based on the most recent Mortgage that was taken out on this home.
Original Mortgage
$205,385
Outstanding Balance
$137,160
Interest Rate
6.69%
Mortgage Type
FHA
Estimated Equity
$272,057
Purchase Details
Closed on
Oct 25, 2006
Sold by
Newman Mary Linda and Szczytko Francis
Bought by
Szczytko Francis and Newman Mary Linda
Home Financials for this Owner
Home Financials are based on the most recent Mortgage that was taken out on this home.
Original Mortgage
$159,950
Interest Rate
6.33%
Mortgage Type
Purchase Money Mortgage
Create a Home Valuation Report for This Property
The Home Valuation Report is an in-depth analysis detailing your home's value as well as a comparison with similar homes in the area
Home Values in the Area
Average Home Value in this Area
Purchase History
| Date | Buyer | Sale Price | Title Company |
|---|---|---|---|
| -- | -- | -- | |
| Szczytko Francis | -- | None Available |
Source: Public Records
Mortgage History
| Date | Status | Borrower | Loan Amount |
|---|---|---|---|
| Open | -- | $205,385 | |
| Previous Owner | Szczytko Francis | $159,950 |
Source: Public Records
Tax History
| Year | Tax Paid | Tax Assessment Tax Assessment Total Assessment is a certain percentage of the fair market value that is determined by local assessors to be the total taxable value of land and additions on the property. | Land | Improvement |
|---|---|---|---|---|
| 2025 | $5,192 | $168,400 | $98,800 | $69,600 |
| 2024 | $4,902 | $168,400 | $98,800 | $69,600 |
| 2023 | $4,744 | $168,400 | $98,800 | $69,600 |
| 2022 | $4,744 | $168,400 | $98,800 | $69,600 |
| 2021 | $4,436 | $168,400 | $98,800 | $69,600 |
| 2020 | $4,700 | $168,400 | $98,800 | $69,600 |
| 2019 | $4,631 | $168,400 | $98,800 | $69,600 |
| 2018 | $4,596 | $168,400 | $98,800 | $69,600 |
| 2017 | $4,520 | $168,400 | $98,800 | $69,600 |
| 2016 | $4,427 | $168,400 | $98,800 | $69,600 |
| 2015 | $4,287 | $168,400 | $98,800 | $69,600 |
| 2014 | $4,178 | $168,400 | $98,800 | $69,600 |
Source: Public Records
Map
Nearby Homes
Your Personal Tour Guide
Ask me questions while you tour the home.