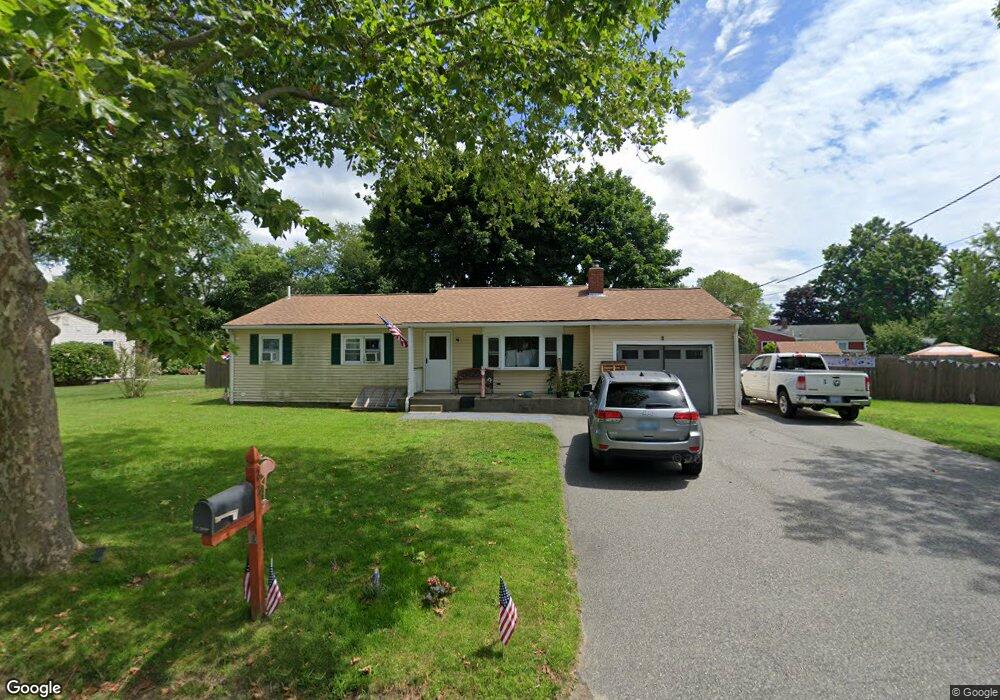
22 Roosevelt Dr Bristol, RI 02809
Mount Hope NeighborhoodEstimated Value: $512,000 - $628,000
3
Beds
2
Baths
2,234
Sq Ft
$252/Sq Ft
Est. Value
About This Home
This home is located at 22 Roosevelt Dr, Bristol, RI 02809 and is currently estimated at $564,053, approximately $252 per square foot. 22 Roosevelt Dr is a home located in Bristol County with nearby schools including Mt. Hope High School, Highlander Charter Middle and High School, and Our Lady of Mt. Carmel School.
Ownership History
Date
Name
Owned For
Owner Type
Purchase Details
Closed on
Jan 12, 2017
Sold by
Groff Melinda M and Groff Edward H
Bought by
Groff Edward H
Current Estimated Value
Purchase Details
Closed on
May 8, 2014
Sold by
Groff Elvira T
Bought by
Groff Melinda M and Groff Edward H
Create a Home Valuation Report for This Property
The Home Valuation Report is an in-depth analysis detailing your home's value as well as a comparison with similar homes in the area
Home Values in the Area
Average Home Value in this Area
Purchase History
| Date | Buyer | Sale Price | Title Company |
|---|---|---|---|
| Groff Edward H | -- | -- | |
| Groff Melinda M | -- | -- | |
| Groff Elvira T | -- | -- |
Source: Public Records
Mortgage History
| Date | Status | Borrower | Loan Amount |
|---|---|---|---|
| Open | Groff Elvira T | $222,000 | |
| Previous Owner | Groff Elvira T | $110,000 | |
| Previous Owner | Groff Elvira T | $75,000 |
Source: Public Records
Tax History
| Year | Tax Paid | Tax Assessment Tax Assessment Total Assessment is a certain percentage of the fair market value that is determined by local assessors to be the total taxable value of land and additions on the property. | Land | Improvement |
|---|---|---|---|---|
| 2025 | $4,818 | $348,600 | $171,400 | $177,200 |
| 2024 | $4,818 | $348,600 | $171,400 | $177,200 |
| 2023 | $4,657 | $348,600 | $171,400 | $177,200 |
| 2022 | $4,532 | $348,600 | $171,400 | $177,200 |
| 2021 | $4,294 | $298,600 | $157,800 | $140,800 |
| 2020 | $4,201 | $298,600 | $157,800 | $140,800 |
| 2019 | $4,097 | $298,600 | $157,800 | $140,800 |
| 2018 | $4,508 | $293,100 | $150,600 | $142,500 |
| 2017 | $3,849 | $258,000 | $130,500 | $127,500 |
| 2016 | $3,703 | $250,700 | $130,500 | $120,200 |
| 2015 | $3,465 | $247,000 | $130,500 | $116,500 |
| 2014 | $3,637 | $278,510 | $149,400 | $129,110 |
Source: Public Records
Map
Nearby Homes
- 26 Roosevelt Dr
- 79 Hopeworth Ave
- 15 Rosedale Dr
- 9 Wapping Dr
- 30 Sowams Dr
- 25 Massasoit Ave
- 27 Massasoit Ave
- 32 Massasoit Ave
- 30 Massasoit Ave
- 556 Metacom Ave
- 64 King Philip Ave
- 85 Bay View Ave Unit 3
- 85 Bay View Ave Unit 2
- 2 Chilton St
- 2 Wilson St
- 236 State St
- 21 Monroe Ave
- 15 Bourne St
- 413 High St
- 22 Harrison St
Your Personal Tour Guide
Ask me questions while you tour the home.