Estimated Value: $1,085,000 - $1,338,283
3
Beds
2
Baths
2,500
Sq Ft
$489/Sq Ft
Est. Value
About This Home
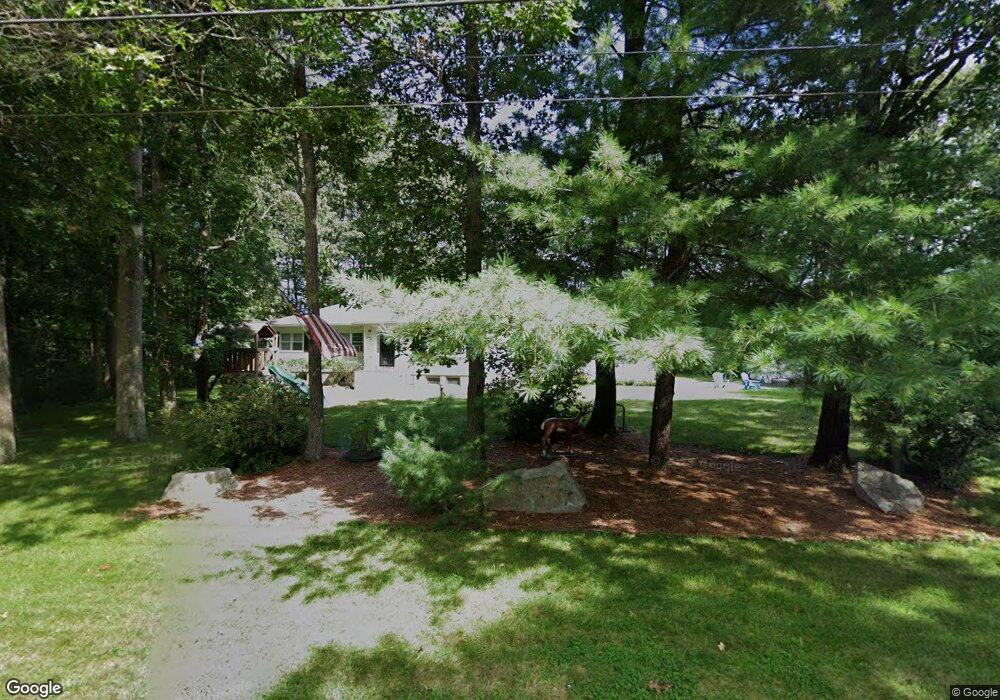
This home is located at 22 Ruel Dr Unit 22, Dover, MA 02030 and is currently estimated at $1,222,821, approximately $489 per square foot. 22 Ruel Dr Unit 22 is a home located in Norfolk County with nearby schools including Chickering Elementary School, Dover-Sherborn Regional Middle School, and Dover-Sherborn Regional High School.
Ownership History
Date
Name
Owned For
Owner Type
Purchase Details
Closed on
Dec 30, 2016
Sold by
Arrow Development Llc
Bought by
Wilkes Aaron T and Wilkes Rachel
Current Estimated Value
Home Financials for this Owner
Home Financials are based on the most recent Mortgage that was taken out on this home.
Original Mortgage
$355,000
Outstanding Balance
$291,037
Interest Rate
3.94%
Mortgage Type
New Conventional
Estimated Equity
$931,784
Create a Home Valuation Report for This Property
The Home Valuation Report is an in-depth analysis detailing your home's value as well as a comparison with similar homes in the area
Home Values in the Area
Average Home Value in this Area
Purchase History
| Date | Buyer | Sale Price | Title Company |
|---|---|---|---|
| Wilkes Aaron T | $605,000 | -- |
Source: Public Records
Mortgage History
| Date | Status | Borrower | Loan Amount |
|---|---|---|---|
| Open | Wilkes Aaron T | $355,000 |
Source: Public Records
Tax History
| Year | Tax Paid | Tax Assessment Tax Assessment Total Assessment is a certain percentage of the fair market value that is determined by local assessors to be the total taxable value of land and additions on the property. | Land | Improvement |
|---|---|---|---|---|
| 2025 | $9,589 | $850,800 | $546,900 | $303,900 |
| 2024 | $8,849 | $807,400 | $546,900 | $260,500 |
| 2023 | $8,795 | $721,500 | $477,500 | $244,000 |
| 2022 | $8,020 | $645,700 | $438,300 | $207,400 |
| 2021 | $8,157 | $632,800 | $438,300 | $194,500 |
| 2020 | $8,125 | $632,800 | $438,300 | $194,500 |
| 2019 | $8,182 | $632,800 | $438,300 | $194,500 |
| 2018 | $7,501 | $584,200 | $399,100 | $185,100 |
| 2017 | $8,699 | $666,600 | $442,700 | $223,900 |
| 2016 | $7,950 | $617,200 | $420,900 | $196,300 |
| 2015 | $7,897 | $621,800 | $420,900 | $200,900 |
Source: Public Records
Map
Nearby Homes
Your Personal Tour Guide
Ask me questions while you tour the home.