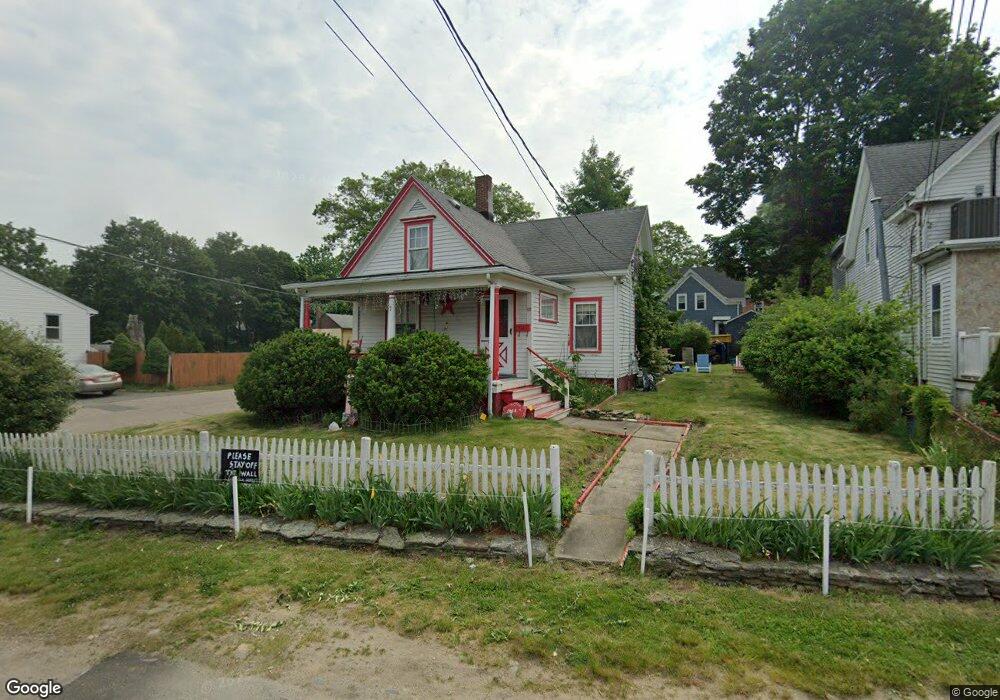
22 S Leyden St Brockton, MA 02302
Campello NeighborhoodEstimated Value: $350,000 - $433,888
3
Beds
1
Bath
900
Sq Ft
$444/Sq Ft
Est. Value
About This Home
This home is located at 22 S Leyden St, Brockton, MA 02302 and is currently estimated at $399,222, approximately $443 per square foot. 22 S Leyden St is a home located in Plymouth County with nearby schools including Davis K-8 School, John F. Kennedy Elementary School, and South Middle School.
Ownership History
Date
Name
Owned For
Owner Type
Purchase Details
Closed on
Oct 23, 2009
Sold by
Mofford Donna J and Capen Robert E
Bought by
Kumar Lisa
Current Estimated Value
Home Financials for this Owner
Home Financials are based on the most recent Mortgage that was taken out on this home.
Original Mortgage
$118,808
Interest Rate
5.09%
Mortgage Type
Purchase Money Mortgage
Create a Home Valuation Report for This Property
The Home Valuation Report is an in-depth analysis detailing your home's value as well as a comparison with similar homes in the area
Home Values in the Area
Average Home Value in this Area
Purchase History
| Date | Buyer | Sale Price | Title Company |
|---|---|---|---|
| Kumar Lisa | $121,000 | -- | |
| Kumar Lisa | $121,000 | -- |
Source: Public Records
Mortgage History
| Date | Status | Borrower | Loan Amount |
|---|---|---|---|
| Open | Kumar Lisa | $117,056 | |
| Closed | Kumar Lisa | $118,808 |
Source: Public Records
Tax History Compared to Growth
Tax History
| Year | Tax Paid | Tax Assessment Tax Assessment Total Assessment is a certain percentage of the fair market value that is determined by local assessors to be the total taxable value of land and additions on the property. | Land | Improvement |
|---|---|---|---|---|
| 2025 | $4,211 | $347,700 | $136,400 | $211,300 |
| 2024 | $4,087 | $340,000 | $136,400 | $203,600 |
| 2023 | $3,537 | $272,500 | $102,100 | $170,400 |
| 2022 | $3,687 | $263,900 | $92,600 | $171,300 |
| 2021 | $3,334 | $229,900 | $76,600 | $153,300 |
| 2020 | $2,965 | $195,700 | $72,200 | $123,500 |
| 2019 | $2,744 | $176,600 | $69,800 | $106,800 |
| 2018 | $2,652 | $165,100 | $69,800 | $95,300 |
| 2017 | $2,415 | $150,000 | $69,800 | $80,200 |
| 2016 | $2,443 | $140,700 | $67,600 | $73,100 |
| 2015 | $2,065 | $113,800 | $67,600 | $46,200 |
| 2014 | $2,127 | $117,300 | $67,600 | $49,700 |
Source: Public Records
Map
Nearby Homes
- 112 Hillside Ave
- 54 Ferris Ave
- 163 S Leyden St
- 223 Clinton St Unit 10
- 223 Clinton St Unit 3
- 44 Baker St
- 34 Carl Ave
- 28 Wallace St
- 103 Clinton St
- 70 Carlisle St
- 12 Paulin Ave
- 265 Summer St
- 65 Tremont St
- 936 Warren Ave
- 99 Grove St
- 977 Warren Ave
- 115 Market St
- 229 Sinclair Rd
- 221 Sinclair Rd
- 29 Hancock St
- 26 S Leyden St
- 17 Sansom St
- 14 S Leyden St
- 28 S Leyden St
- 19 Sansom St Unit 2
- 21 Sansom St Unit 1
- 23 S Leyden St
- 16 Sansom St
- 8 S Leyden St
- 29 S Leyden St
- 13 S Leyden St
- 182 Perkins Ave
- 18 Sansom St
- 43 Jackson St
- 172 Perkins Ave
- 45 Jackson St
- 19 S Leyden St
- 49 Riverview St
- 166 Perkins Ave
- 27 Jackson St