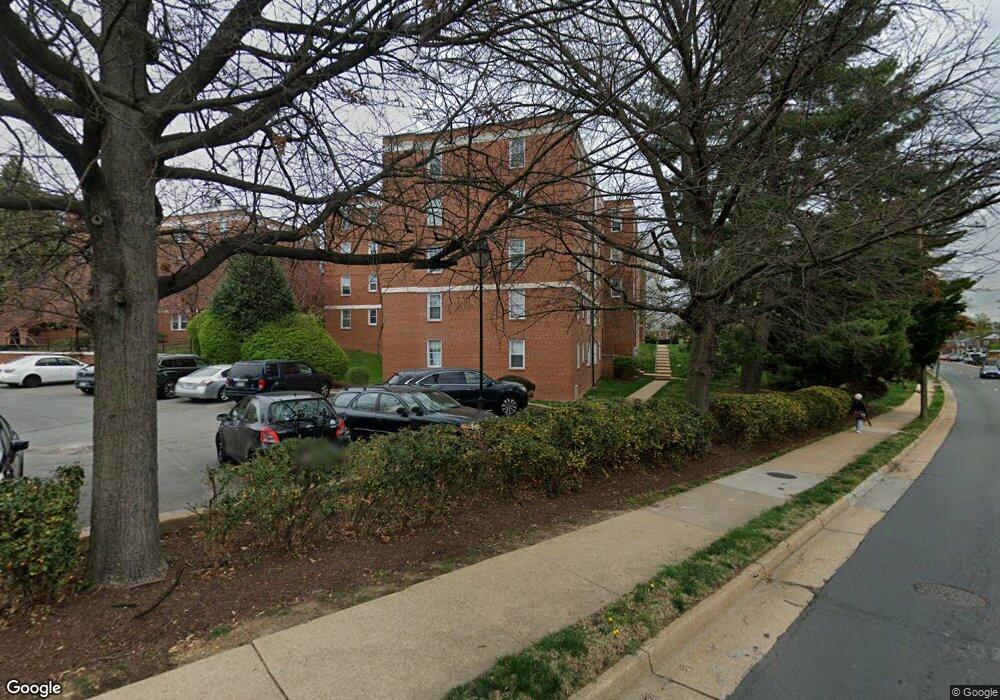
22 S Old Glebe Rd Unit 3D Arlington, VA 22204
Arlington Heights NeighborhoodEstimated Value: $245,000 - $325,000
1
Bed
1
Bath
662
Sq Ft
$411/Sq Ft
Est. Value
About This Home
This home is located at 22 S Old Glebe Rd Unit 3D, Arlington, VA 22204 and is currently estimated at $272,261, approximately $411 per square foot. 22 S Old Glebe Rd Unit 3D is a home located in Arlington County with nearby schools including Thomas Jefferson Middle School, Wakefield High School, and St. Thomas More Cathedral School.
Ownership History
Date
Name
Owned For
Owner Type
Purchase Details
Closed on
Aug 23, 2005
Sold by
Khosraviani Sohrab
Bought by
Ali Roni
Current Estimated Value
Home Financials for this Owner
Home Financials are based on the most recent Mortgage that was taken out on this home.
Original Mortgage
$50,400
Interest Rate
5.25%
Mortgage Type
Stand Alone Second
Purchase Details
Closed on
Jan 16, 2001
Sold by
Sec Of H U D
Bought by
Khosraviani Sohrab
Home Financials for this Owner
Home Financials are based on the most recent Mortgage that was taken out on this home.
Original Mortgage
$47,200
Interest Rate
7.39%
Purchase Details
Closed on
Feb 26, 2000
Sold by
Yacko Keith M
Bought by
Dept Housing And Urban Dev
Purchase Details
Closed on
Feb 16, 1994
Sold by
Rickerich By Atty A A
Bought by
Morse Janie C
Home Financials for this Owner
Home Financials are based on the most recent Mortgage that was taken out on this home.
Original Mortgage
$67,050
Interest Rate
7.18%
Create a Home Valuation Report for This Property
The Home Valuation Report is an in-depth analysis detailing your home's value as well as a comparison with similar homes in the area
Home Values in the Area
Average Home Value in this Area
Purchase History
| Date | Buyer | Sale Price | Title Company |
|---|---|---|---|
| Ali Roni | $252,000 | -- | |
| Khosraviani Sohrab | $59,000 | -- | |
| Dept Housing And Urban Dev | $71,570 | -- | |
| Morse Janie C | $68,000 | -- |
Source: Public Records
Mortgage History
| Date | Status | Borrower | Loan Amount |
|---|---|---|---|
| Closed | Ali Roni | $50,400 | |
| Open | Ali Roni | $201,600 | |
| Previous Owner | Khosraviani Sohrab | $47,200 | |
| Previous Owner | Morse Janie C | $67,050 |
Source: Public Records
Tax History Compared to Growth
Tax History
| Year | Tax Paid | Tax Assessment Tax Assessment Total Assessment is a certain percentage of the fair market value that is determined by local assessors to be the total taxable value of land and additions on the property. | Land | Improvement |
|---|---|---|---|---|
| 2025 | $2,504 | $242,400 | $51,000 | $191,400 |
| 2024 | $2,357 | $228,200 | $51,000 | $177,200 |
| 2023 | $2,446 | $237,500 | $51,000 | $186,500 |
| 2022 | $2,446 | $237,500 | $51,000 | $186,500 |
| 2021 | $2,391 | $232,100 | $51,000 | $181,100 |
| 2020 | $2,125 | $207,100 | $23,800 | $183,300 |
| 2019 | $1,924 | $187,500 | $23,800 | $163,700 |
| 2018 | $1,886 | $187,500 | $23,800 | $163,700 |
| 2017 | $1,886 | $187,500 | $23,800 | $163,700 |
| 2016 | $1,842 | $185,900 | $23,800 | $162,100 |
| 2015 | $1,790 | $179,700 | $23,800 | $155,900 |
| 2014 | $1,759 | $176,600 | $23,800 | $152,800 |
Source: Public Records
Map
Nearby Homes
- 102 S Glebe Rd
- 3726 3rd St S
- 3701 5th St S Unit 406
- 3701 5th St S Unit 212
- 3601 5th St S Unit 206
- 3720 5th St S
- 3851 2nd St N
- 3501 7th St S
- 3919 7th St S
- 231 N Thomas St Unit 105
- 3402 8th St S
- 112 N Highland St
- 34 N Garfield St
- 4501 Arlington Blvd Unit 707
- 2810 5th St S
- 2813 Arlington Blvd Unit 159
- 919 S Monroe St
- 2803 Arlington Blvd Unit 130
- 502 N Jackson St
- 2604 1st St S
- 22 S Old Glebe Rd Unit 4D
- 22 S Old Glebe Rd Unit 201D
- 22 S Old Glebe Rd Unit 103D
- 22 S Old Glebe Rd Unit 303D
- 22 S Old Glebe Rd Unit 1D
- 22 S Old Glebe Rd Unit 106D
- 22 S Old Glebe Rd Unit 8D
- 22 S Old Glebe Rd Unit 6D
- 22 S Old Glebe Rd Unit 102D
- 22 S Old Glebe Rd Unit 101D
- 22 S Old Glebe Rd Unit 306D
- 22 S Old Glebe Rd Unit 305D
- 22 S Old Glebe Rd Unit 304D
- 22 S Old Glebe Rd Unit 302D
- 22 S Old Glebe Rd Unit 301D
- 22 S Old Glebe Rd Unit 206D
- 22 S Old Glebe Rd Unit 205D
- 22 S Old Glebe Rd Unit 204D
- 22 S Old Glebe Rd Unit 203D
- 22 S Old Glebe Rd Unit 202D