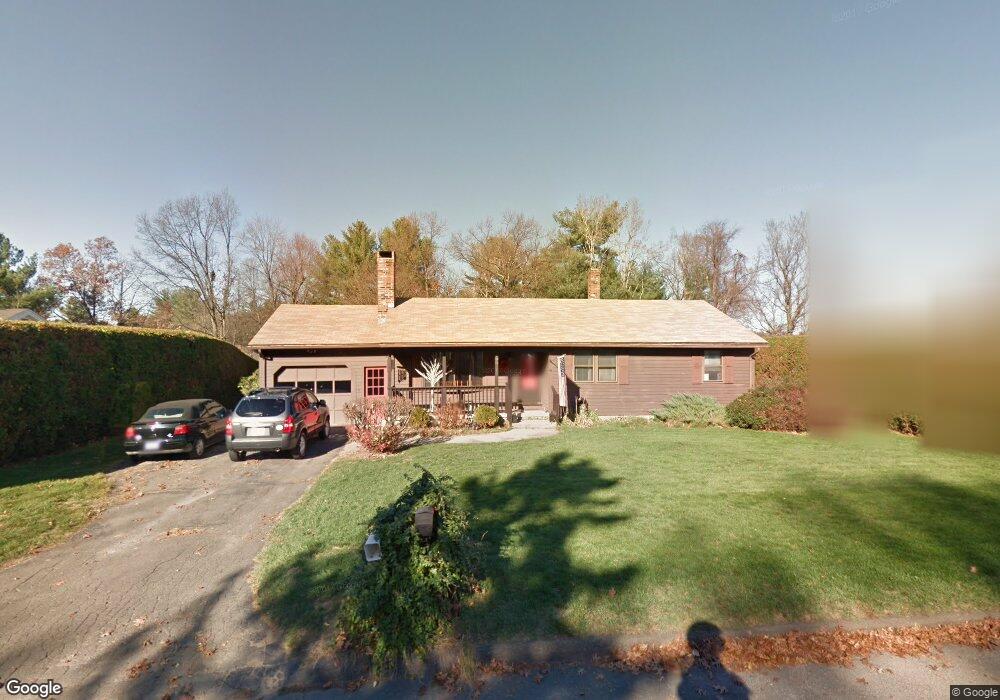
22 Sandra Rd Easthampton, MA 01027
Estimated Value: $372,000 - $445,000
3
Beds
2
Baths
1,072
Sq Ft
$383/Sq Ft
Est. Value
About This Home
This home is located at 22 Sandra Rd, Easthampton, MA 01027 and is currently estimated at $410,201, approximately $382 per square foot. 22 Sandra Rd is a home located in Hampshire County with nearby schools including Easthampton High School, Calvary Baptist Christian School, and Tri-County Schools.
Ownership History
Date
Name
Owned For
Owner Type
Purchase Details
Closed on
Jan 25, 2013
Sold by
Warkulewicz Edwin S
Bought by
Warkulewicz Edwin S and Warkulewicz Jayne C
Current Estimated Value
Purchase Details
Closed on
May 28, 1993
Sold by
Konicki Eva J and Konicki Edward E
Bought by
Warkulewicz Rosemarie and Warkulewicz Edwin
Home Financials for this Owner
Home Financials are based on the most recent Mortgage that was taken out on this home.
Original Mortgage
$97,000
Interest Rate
7.41%
Mortgage Type
Purchase Money Mortgage
Create a Home Valuation Report for This Property
The Home Valuation Report is an in-depth analysis detailing your home's value as well as a comparison with similar homes in the area
Home Values in the Area
Average Home Value in this Area
Purchase History
| Date | Buyer | Sale Price | Title Company |
|---|---|---|---|
| Warkulewicz Edwin S | -- | -- | |
| Warkulewicz Rosemarie | $127,000 | -- |
Source: Public Records
Mortgage History
| Date | Status | Borrower | Loan Amount |
|---|---|---|---|
| Previous Owner | Warkulewicz Rosemarie | $93,000 | |
| Previous Owner | Warkulewicz Rosemarie | $97,000 |
Source: Public Records
Tax History
| Year | Tax Paid | Tax Assessment Tax Assessment Total Assessment is a certain percentage of the fair market value that is determined by local assessors to be the total taxable value of land and additions on the property. | Land | Improvement |
|---|---|---|---|---|
| 2025 | $5,434 | $397,500 | $119,100 | $278,400 |
| 2024 | $5,245 | $386,800 | $115,600 | $271,200 |
| 2023 | $4,099 | $279,800 | $91,000 | $188,800 |
| 2022 | $4,625 | $279,800 | $91,000 | $188,800 |
| 2021 | $5,073 | $289,200 | $91,000 | $198,200 |
| 2020 | $4,969 | $279,800 | $91,000 | $188,800 |
| 2019 | $4,000 | $258,700 | $91,000 | $167,700 |
| 2018 | $3,829 | $239,300 | $85,900 | $153,400 |
| 2017 | $3,736 | $230,500 | $82,500 | $148,000 |
| 2016 | $3,593 | $230,500 | $82,500 | $148,000 |
| 2015 | $3,492 | $230,500 | $82,500 | $148,000 |
Source: Public Records
Map
Nearby Homes
Your Personal Tour Guide
Ask me questions while you tour the home.