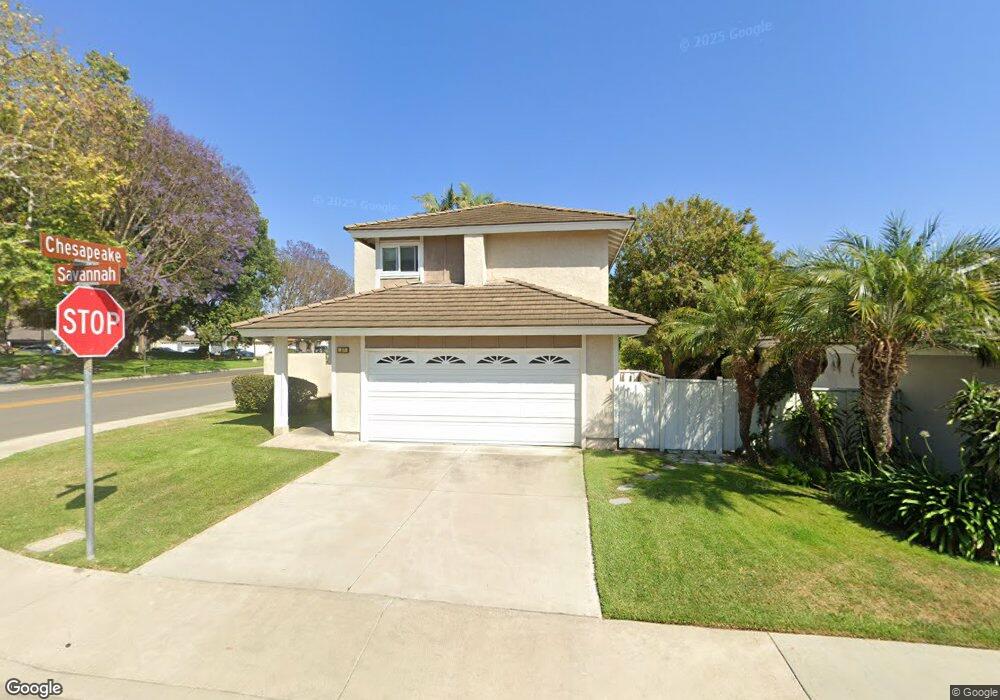
22 Savannah Irvine, CA 92620
Northwood NeighborhoodEstimated Value: $1,583,911 - $1,775,000
4
Beds
3
Baths
2,010
Sq Ft
$831/Sq Ft
Est. Value
About This Home
This home is located at 22 Savannah, Irvine, CA 92620 and is currently estimated at $1,669,728, approximately $830 per square foot. 22 Savannah is a home located in Orange County with nearby schools including Brywood Elementary School, Sierra Vista Middle School, and Northwood High School.
Ownership History
Date
Name
Owned For
Owner Type
Purchase Details
Closed on
Mar 27, 2020
Sold by
Shiva Mostafa
Bought by
Shiva Mostafa Mo and The Mostafa Shiva Family Livin
Current Estimated Value
Purchase Details
Closed on
Apr 5, 2012
Sold by
Shiva Mostafa
Bought by
Shiva Mostafa
Home Financials for this Owner
Home Financials are based on the most recent Mortgage that was taken out on this home.
Original Mortgage
$212,000
Interest Rate
3.84%
Mortgage Type
New Conventional
Purchase Details
Closed on
May 8, 2002
Sold by
Moshar Sianoosh
Bought by
Shiva Mostafa
Home Financials for this Owner
Home Financials are based on the most recent Mortgage that was taken out on this home.
Original Mortgage
$300,700
Interest Rate
7.13%
Create a Home Valuation Report for This Property
The Home Valuation Report is an in-depth analysis detailing your home's value as well as a comparison with similar homes in the area
Home Values in the Area
Average Home Value in this Area
Purchase History
| Date | Buyer | Sale Price | Title Company |
|---|---|---|---|
| Shiva Mostafa Mo | -- | None Available | |
| Shiva Mostafa | -- | Fidelity National Title | |
| Shiva Mostafa | -- | Equity Title Company |
Source: Public Records
Mortgage History
| Date | Status | Borrower | Loan Amount |
|---|---|---|---|
| Closed | Shiva Mostafa | $212,000 | |
| Closed | Shiva Mostafa | $300,700 |
Source: Public Records
Tax History
| Year | Tax Paid | Tax Assessment Tax Assessment Total Assessment is a certain percentage of the fair market value that is determined by local assessors to be the total taxable value of land and additions on the property. | Land | Improvement |
|---|---|---|---|---|
| 2025 | $6,214 | $597,921 | $384,371 | $213,550 |
| 2024 | $6,214 | $586,198 | $376,835 | $209,363 |
| 2023 | $6,052 | $574,704 | $369,446 | $205,258 |
| 2022 | $5,934 | $563,436 | $362,202 | $201,234 |
| 2021 | $5,797 | $552,389 | $355,100 | $197,289 |
| 2020 | $5,764 | $546,725 | $351,458 | $195,267 |
| 2019 | $5,635 | $536,005 | $344,566 | $191,439 |
| 2018 | $5,534 | $525,496 | $337,810 | $187,686 |
| 2017 | $5,418 | $515,193 | $331,187 | $184,006 |
| 2016 | $5,179 | $505,092 | $324,693 | $180,399 |
| 2015 | $5,100 | $497,506 | $319,816 | $177,690 |
| 2014 | $5,001 | $487,761 | $313,551 | $174,210 |
Source: Public Records
Map
Nearby Homes
Your Personal Tour Guide
Ask me questions while you tour the home.