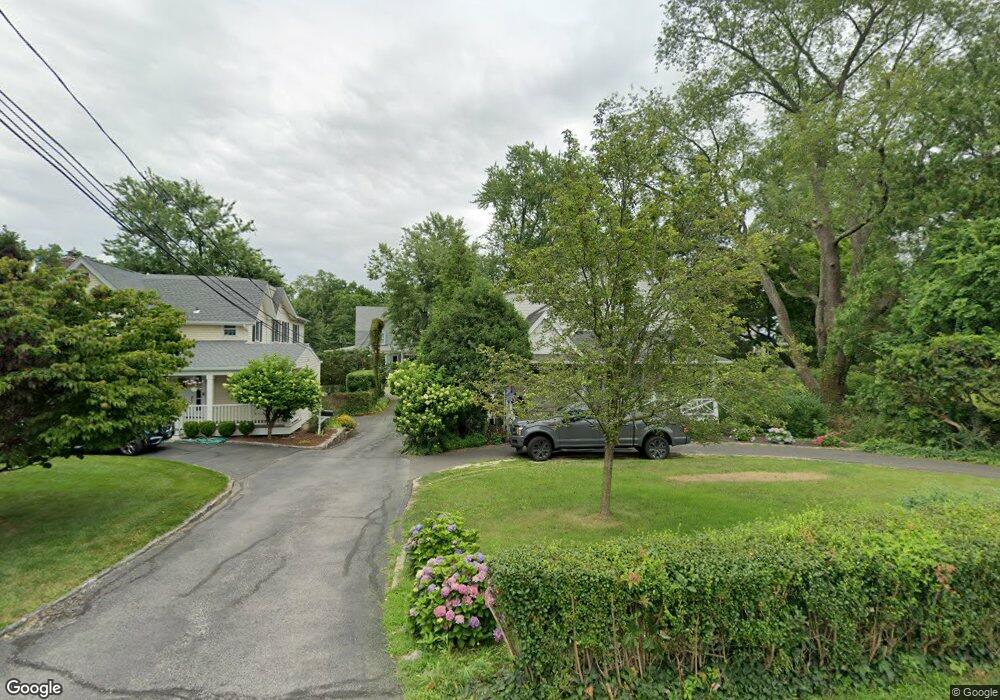
22 Shore Rd Old Greenwich, CT 06870
Old Greenwich NeighborhoodEstimated Value: $2,047,000 - $4,866,000
3
Beds
3
Baths
2,756
Sq Ft
$1,213/Sq Ft
Est. Value
About This Home
This home is located at 22 Shore Rd, Old Greenwich, CT 06870 and is currently estimated at $3,344,246, approximately $1,213 per square foot. 22 Shore Rd is a home located in Fairfield County with nearby schools including Old Greenwich School, Eastern Middle School, and Greenwich High School.
Ownership History
Date
Name
Owned For
Owner Type
Purchase Details
Closed on
Jul 12, 2000
Sold by
Lang Dana M
Bought by
Chiappinelli Anthony J and Chiappinelli Vivian
Current Estimated Value
Purchase Details
Closed on
Mar 16, 1999
Sold by
Est Rosner Maria and Ronan Martin W
Bought by
Lang Dana M
Create a Home Valuation Report for This Property
The Home Valuation Report is an in-depth analysis detailing your home's value as well as a comparison with similar homes in the area
Home Values in the Area
Average Home Value in this Area
Purchase History
| Date | Buyer | Sale Price | Title Company |
|---|---|---|---|
| Chiappinelli Anthony J | $407,500 | -- | |
| Lang Dana M | $295,000 | -- |
Source: Public Records
Mortgage History
| Date | Status | Borrower | Loan Amount |
|---|---|---|---|
| Open | Lang Dana M | $850,000 | |
| Closed | Lang Dana M | $499,999 |
Source: Public Records
Tax History Compared to Growth
Tax History
| Year | Tax Paid | Tax Assessment Tax Assessment Total Assessment is a certain percentage of the fair market value that is determined by local assessors to be the total taxable value of land and additions on the property. | Land | Improvement |
|---|---|---|---|---|
| 2025 | $16,289 | $1,317,960 | $977,690 | $340,270 |
| 2024 | $15,731 | $1,317,960 | $977,690 | $340,270 |
| 2023 | $15,336 | $1,317,960 | $977,690 | $340,270 |
| 2022 | $15,196 | $1,317,960 | $977,690 | $340,270 |
| 2021 | $14,915 | $1,238,790 | $860,300 | $378,490 |
| 2020 | $14,890 | $1,238,790 | $860,300 | $378,490 |
| 2019 | $15,039 | $1,238,790 | $860,300 | $378,490 |
| 2018 | $14,704 | $1,238,790 | $860,300 | $378,490 |
| 2017 | $14,889 | $1,238,790 | $860,300 | $378,490 |
| 2016 | $14,654 | $1,238,790 | $860,300 | $378,490 |
| 2015 | $14,242 | $1,194,270 | $1,045,590 | $148,680 |
| 2014 | $13,883 | $1,194,270 | $1,045,590 | $148,680 |
Source: Public Records
Map
Nearby Homes
- 54 Signal Rd
- 50 Signal Rd
- 46 Signal Rd
- 42 Signal Rd
- 45 Binney Ln
- 602 Fairfield Ave
- 348 Sound Beach Ave
- 20 Cook Rd
- 137 Shore Rd
- 7 Highview Ave
- 34 Davenport Dr
- 8 Park Ave
- 11 Shorelands Place
- 145 Shore Rd
- 8 Quintard Ave
- 51 Forest Ave Unit 98
- 98 Southfield Ave Unit 101
- 200 Shore Rd
- 22 Summit Rd
- 40 Orchard St