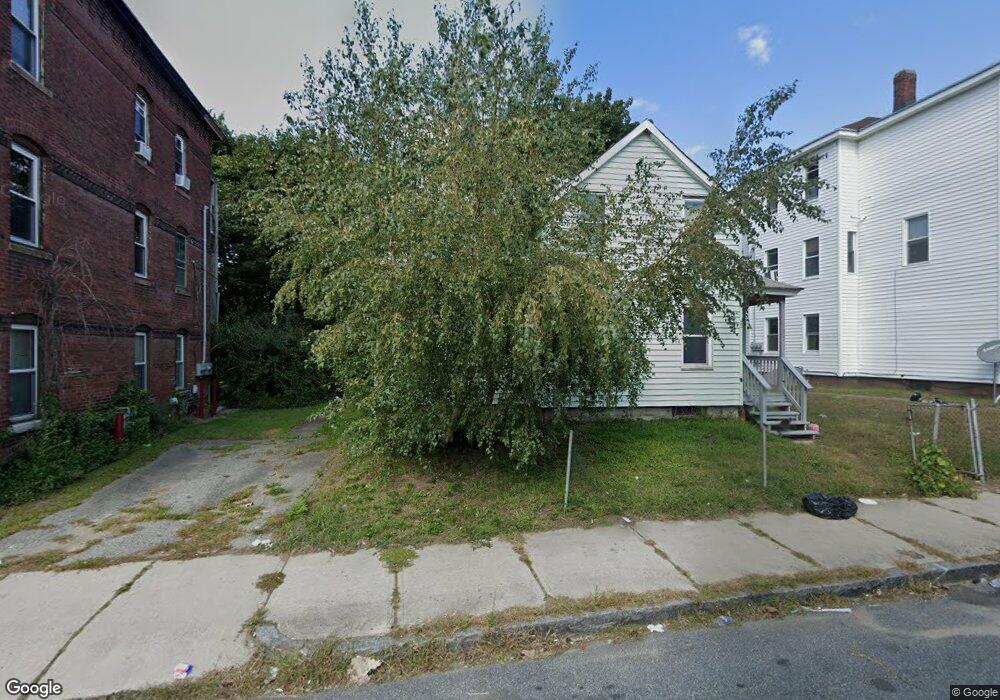
22 Sigel St Worcester, MA 01610
Green Island NeighborhoodEstimated Value: $323,000 - $392,000
4
Beds
1
Bath
1,204
Sq Ft
$289/Sq Ft
Est. Value
About This Home
This home is located at 22 Sigel St, Worcester, MA 01610 and is currently estimated at $347,692, approximately $288 per square foot. 22 Sigel St is a home located in Worcester County with nearby schools including Jacob Hiatt Magnet School, Chandler Elementary Community School, and Chandler Magnet.
Ownership History
Date
Name
Owned For
Owner Type
Purchase Details
Closed on
Jun 8, 1987
Sold by
Tamburro Dale J
Bought by
Mcallister Douglas C
Current Estimated Value
Create a Home Valuation Report for This Property
The Home Valuation Report is an in-depth analysis detailing your home's value as well as a comparison with similar homes in the area
Home Values in the Area
Average Home Value in this Area
Purchase History
| Date | Buyer | Sale Price | Title Company |
|---|---|---|---|
| Mcallister Douglas C | $84,000 | -- |
Source: Public Records
Mortgage History
| Date | Status | Borrower | Loan Amount |
|---|---|---|---|
| Open | Mcallister Douglas C | $63,500 | |
| Closed | Mcallister Douglas C | $49,000 | |
| Closed | Mcallister Douglas C | $17,700 | |
| Closed | Mcallister Douglas C | $60,000 |
Source: Public Records
Tax History
| Year | Tax Paid | Tax Assessment Tax Assessment Total Assessment is a certain percentage of the fair market value that is determined by local assessors to be the total taxable value of land and additions on the property. | Land | Improvement |
|---|---|---|---|---|
| 2025 | $3,477 | $263,600 | $66,900 | $196,700 |
| 2024 | $3,308 | $240,600 | $66,900 | $173,700 |
| 2023 | $3,126 | $218,000 | $53,700 | $164,300 |
| 2022 | $2,898 | $190,500 | $42,900 | $147,600 |
| 2021 | $2,776 | $170,500 | $34,400 | $136,100 |
| 2020 | $2,625 | $154,400 | $34,500 | $119,900 |
| 2019 | $2,576 | $143,100 | $34,000 | $109,100 |
| 2018 | $2,562 | $135,500 | $34,000 | $101,500 |
| 2017 | $2,433 | $126,600 | $34,000 | $92,600 |
| 2016 | $2,500 | $121,300 | $27,900 | $93,400 |
| 2015 | $2,434 | $121,300 | $27,900 | $93,400 |
| 2014 | $2,370 | $121,300 | $27,900 | $93,400 |
Source: Public Records
Map
Nearby Homes
- 13 Sigel St
- 195 Millbury St
- 49 Richland St
- 69 Oread St
- 82 Fox St
- 13 Sterling St
- 52 Harrison St
- 709 Main St
- 1 Arlington St
- 64 Green St
- 22 Waverly St
- 70 Southbridge St Unit 611
- 70 Southbridge St Unit 310
- 172 Perry Ave Unit 1A
- 172 Perry Ave Unit 2B
- 607 Cambridge St Unit 4
- 32 Providence St Unit 5
- 32 Providence St Unit 9
- 20 Washburn St
- 26 South St
Your Personal Tour Guide
Ask me questions while you tour the home.