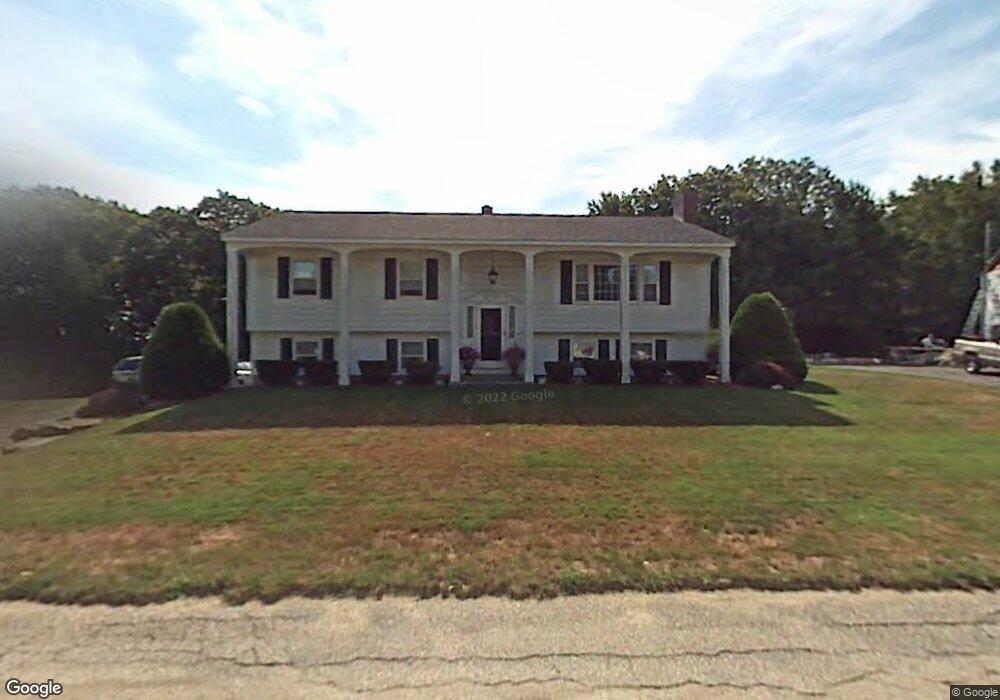
22 Skyline Dr Clinton, MA 01510
Estimated Value: $469,000 - $513,000
3
Beds
1
Bath
1,189
Sq Ft
$409/Sq Ft
Est. Value
About This Home
This home is located at 22 Skyline Dr, Clinton, MA 01510 and is currently estimated at $485,837, approximately $408 per square foot. 22 Skyline Dr is a home located in Worcester County with nearby schools including Clinton Elementary School, Clinton Senior High School, and Clinton Middle School.
Ownership History
Date
Name
Owned For
Owner Type
Purchase Details
Closed on
Feb 18, 2022
Sold by
Hernandez Alicia B
Bought by
Cruz Jennifer E
Current Estimated Value
Home Financials for this Owner
Home Financials are based on the most recent Mortgage that was taken out on this home.
Original Mortgage
$80,000
Outstanding Balance
$73,860
Interest Rate
3.55%
Mortgage Type
Purchase Money Mortgage
Estimated Equity
$411,977
Purchase Details
Closed on
Mar 18, 2011
Sold by
Grady William F and Grady Marlene G
Bought by
Skyline Rt and Grady
Purchase Details
Closed on
Jun 23, 2004
Sold by
Odonnell Carol S
Bought by
Grady Marlene G and Grady William F
Create a Home Valuation Report for This Property
The Home Valuation Report is an in-depth analysis detailing your home's value as well as a comparison with similar homes in the area
Home Values in the Area
Average Home Value in this Area
Purchase History
| Date | Buyer | Sale Price | Title Company |
|---|---|---|---|
| Cruz Jennifer E | $125,000 | None Available | |
| Skyline Rt | -- | -- | |
| Skyline Rt | -- | -- | |
| Grady Marlene G | -- | -- | |
| Grady Marlene G | -- | -- |
Source: Public Records
Mortgage History
| Date | Status | Borrower | Loan Amount |
|---|---|---|---|
| Open | Cruz Jennifer E | $80,000 | |
| Previous Owner | Grady Marlene G | $50,000 | |
| Previous Owner | Grady Marlene G | $50,000 |
Source: Public Records
Tax History
| Year | Tax Paid | Tax Assessment Tax Assessment Total Assessment is a certain percentage of the fair market value that is determined by local assessors to be the total taxable value of land and additions on the property. | Land | Improvement |
|---|---|---|---|---|
| 2025 | $5,950 | $447,400 | $146,300 | $301,100 |
| 2024 | $5,498 | $418,400 | $146,300 | $272,100 |
| 2023 | $5,045 | $377,300 | $133,000 | $244,300 |
| 2022 | $5,122 | $343,500 | $120,900 | $222,600 |
| 2021 | $5,078 | $318,600 | $115,300 | $203,300 |
| 2020 | $4,783 | $308,800 | $115,300 | $193,500 |
| 2019 | $4,865 | $305,400 | $111,900 | $193,500 |
| 2018 | $4,756 | $280,100 | $107,500 | $172,600 |
| 2017 | $4,587 | $259,600 | $107,500 | $152,100 |
| 2016 | $4,564 | $264,300 | $107,500 | $156,800 |
| 2015 | $3,973 | $238,500 | $107,500 | $131,000 |
| 2014 | $3,852 | $238,500 | $107,500 | $131,000 |
Source: Public Records
Map
Nearby Homes
- 288 Grove St Unit 288
- 5 Richman St
- 30 Richman St
- 125 Grove St
- 355 Main St
- 66 Oak St Unit 66
- 2 Eagle Nest Unit B6-2
- 109 Oak St
- 115117 Mechanic St Unit 4
- 115117 Mechanic St Unit 3
- 43 Berlin St Unit 411
- 23 Ash St
- 11 Lindbergh Street Rear
- 23 Coyne St
- 55 Sterling St Unit 306
- 55 Sterling St Unit 312
- 55 Sterling St Unit 314
- 55 Sterling St Unit 212
- 25 Pearl St
- 155 Cedar St
Your Personal Tour Guide
Ask me questions while you tour the home.