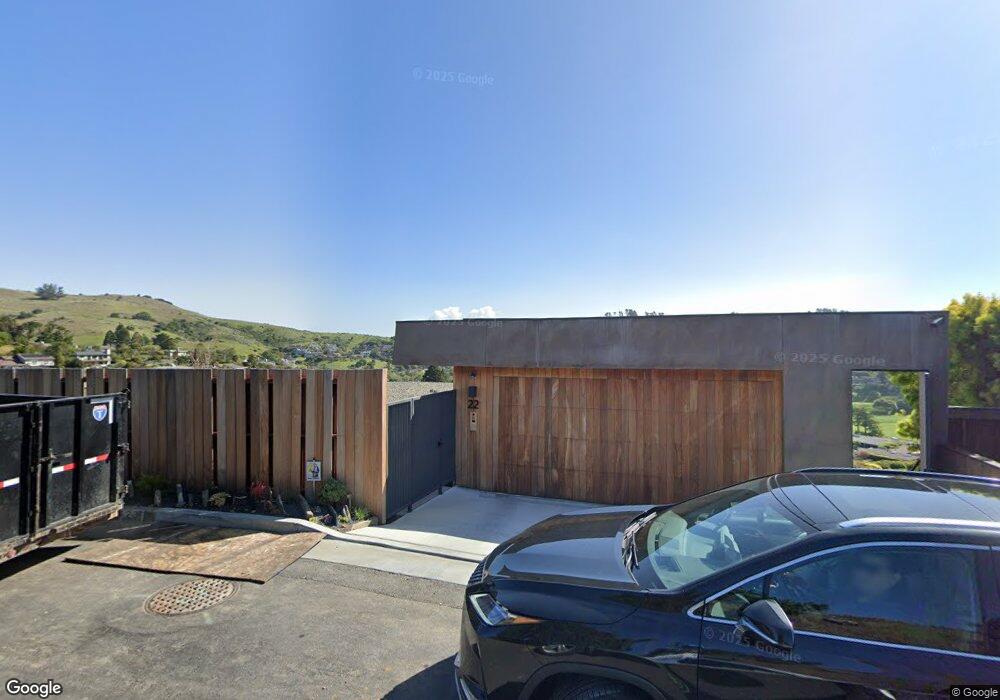
22 Southridge Rd E Belvedere Tiburon, CA 94920
Estimated Value: $2,975,000 - $3,288,000
3
Beds
3
Baths
2,217
Sq Ft
$1,387/Sq Ft
Est. Value
About This Home
This home is located at 22 Southridge Rd E, Belvedere Tiburon, CA 94920 and is currently estimated at $3,075,308, approximately $1,387 per square foot. 22 Southridge Rd E is a home located in Marin County with nearby schools including Bel Aire Elementary School, Reed Elementary School, and Del Mar Middle School.
Ownership History
Date
Name
Owned For
Owner Type
Purchase Details
Closed on
Apr 22, 2009
Sold by
Osher William D and Osher Genine T
Bought by
Osher William David and Osher Genine
Current Estimated Value
Home Financials for this Owner
Home Financials are based on the most recent Mortgage that was taken out on this home.
Original Mortgage
$417,000
Outstanding Balance
$264,741
Interest Rate
5.02%
Mortgage Type
New Conventional
Estimated Equity
$2,810,567
Purchase Details
Closed on
Apr 6, 2006
Sold by
Osher William D and Osher Genine T
Bought by
Osher William David and Osher Genine
Purchase Details
Closed on
May 10, 1994
Sold by
Bezanson David P
Bought by
Osher William D and Osher Genine T
Home Financials for this Owner
Home Financials are based on the most recent Mortgage that was taken out on this home.
Original Mortgage
$485,000
Interest Rate
4.37%
Create a Home Valuation Report for This Property
The Home Valuation Report is an in-depth analysis detailing your home's value as well as a comparison with similar homes in the area
Home Values in the Area
Average Home Value in this Area
Purchase History
| Date | Buyer | Sale Price | Title Company |
|---|---|---|---|
| Osher William David | -- | Stewart Title Of California | |
| Osher William D | -- | Stewart Title Of California | |
| Osher William David | -- | None Available | |
| Osher William D | -- | None Available | |
| Osher William D | $611,000 | -- |
Source: Public Records
Mortgage History
| Date | Status | Borrower | Loan Amount |
|---|---|---|---|
| Open | Osher William D | $417,000 | |
| Closed | Osher William D | $485,000 |
Source: Public Records
Tax History Compared to Growth
Tax History
| Year | Tax Paid | Tax Assessment Tax Assessment Total Assessment is a certain percentage of the fair market value that is determined by local assessors to be the total taxable value of land and additions on the property. | Land | Improvement |
|---|---|---|---|---|
| 2025 | $22,549 | $2,094,135 | $553,424 | $1,540,711 |
| 2024 | $22,549 | $1,953,076 | $542,573 | $1,410,503 |
| 2023 | $17,490 | $1,477,036 | $531,935 | $945,101 |
| 2022 | $13,877 | $1,031,409 | $521,505 | $509,904 |
| 2021 | $13,672 | $1,011,186 | $511,280 | $499,906 |
| 2020 | $13,550 | $1,000,824 | $506,040 | $494,784 |
| 2019 | $13,074 | $981,202 | $496,119 | $485,083 |
| 2018 | $12,407 | $961,966 | $486,393 | $475,573 |
| 2017 | $12,092 | $943,108 | $476,858 | $466,250 |
| 2016 | $11,469 | $924,618 | $467,509 | $457,109 |
| 2015 | $11,341 | $910,734 | $460,489 | $450,245 |
| 2014 | $10,961 | $892,895 | $451,469 | $441,426 |
Source: Public Records
Map
Nearby Homes
- 2 Greenwood Ct
- 472 Irving Ct
- 10 East Terrace
- 10 Andrew Dr Unit 61
- 448 Greenwood Beach Rd
- 14 Janet Way Unit 151
- 3 Trestle Glen Cir
- 107 Blackfield Dr
- 27 Strawberry Cir
- 35 Strawberry Cir
- 22 Venus Ct
- 100 Monterey Dr
- 0 E Strawberry Dr
- 25 Mark Terrace
- 11 Sky Rd
- 124 Mission Dr
- 696 Hawthorne Dr
- 100 Milland Dr
- 88 Milland Dr
- 2800 Paradise Dr
- 20 Southridge Rd E
- 24 Southridge Rd E
- 17 Reed Ranch Rd
- 13 Reed Ranch Rd
- 26 Southridge Rd E
- 46 Southridge Rd W
- 18 Southridge Rd E
- 11 Reed Ranch Rd
- 20 Reed Ranch Rd
- 44 Southridge Rd W
- 18 Reed Ranch Rd
- 16 Reed Ranch Rd
- 16 Southridge Rd E
- 28 Southridge Rd E
- 2 East Terrace
- 32 Southridge Dr
- 9 Reed Ranch Rd
- 47 Southridge Rd W
- 24 Reed Ranch Rd
- 1 Greenwood Ct