J
Landlord's Agent in 2023
Jing Zheng
Keller Williams Realty
(617) 599-3169
9 in this area
129 Total Sales
Estimated Value: $497,000 - $591,000
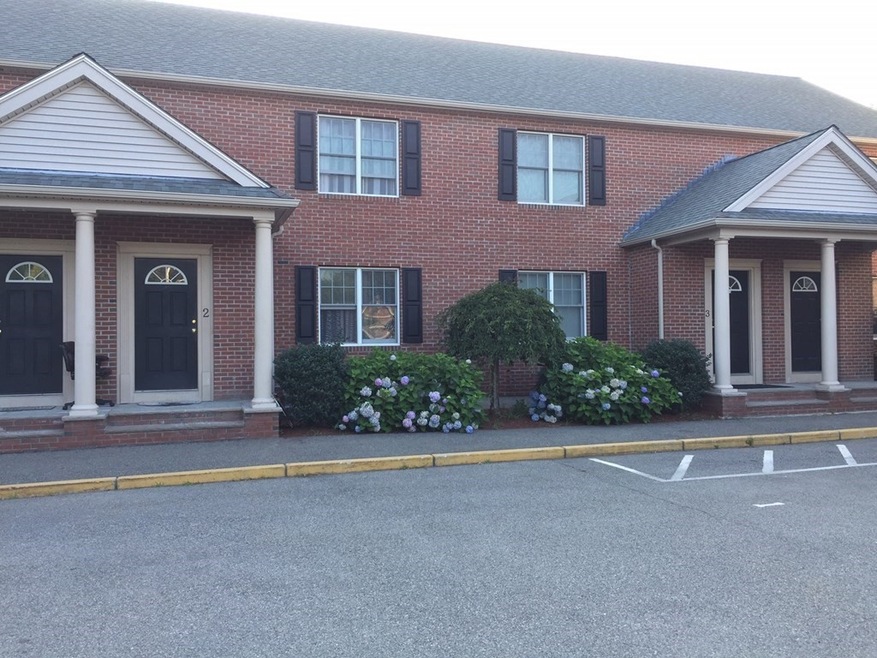
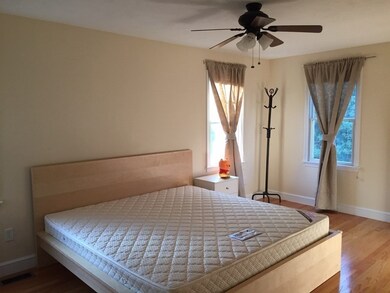
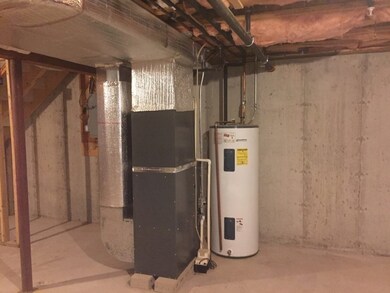
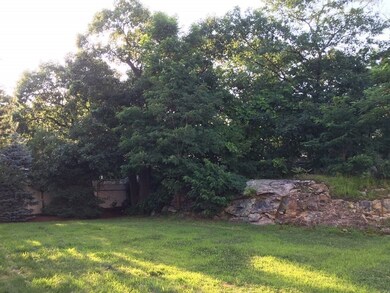
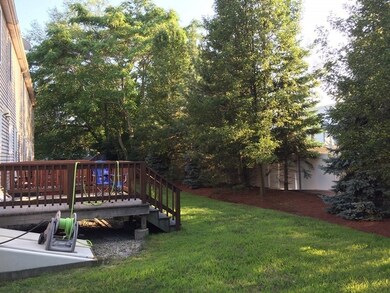
This fabulous townhouse corner unit is recently built in 2007, located off Quincy Ave, on a quiet dead end st. It has lots of sunlight, features 2 bedrooms and 1.5 baths, is close to supermarkets, restaurants and shopping. The eat-in kitchen is spacious with a designated dining area, maple cabinets, stainless steel appliances, and stone backsplash. Granite countertops in kitchen and bathrooms, shiny hardwood floors in living room and bedrooms. In the rear is a private deck and plenty of green space. Central heating and cooling. Parking for 2 cars. Tenant pays for all utilities, including water and sewer. Easy access to Interstate 93N/S, and Route 128. Available for immediate occupancy. Brokerage Fees apply.
| Date | Buyer | Sale Price | Title Company |
|---|---|---|---|
| Ho Jun Q | $280,000 | -- |
| Date | Status | Borrower | Loan Amount |
|---|---|---|---|
| Open | Ho Jun Q | $224,000 |
| Date | Event | Price | List to Sale | Price per Sq Ft | Prior Sale |
|---|---|---|---|---|---|
| 01/15/2023 01/15/23 | Rented | $2,500 | 0.0% | -- | |
| 01/07/2023 01/07/23 | Under Contract | -- | -- | -- | |
| 12/20/2022 12/20/22 | Off Market | $2,500 | -- | -- | |
| 12/19/2022 12/19/22 | For Rent | $2,500 | 0.0% | -- | |
| 11/17/2016 11/17/16 | Sold | $344,000 | +8.2% | $287 / Sq Ft | View Prior Sale |
| 09/24/2016 09/24/16 | Pending | -- | -- | -- | |
| 09/21/2016 09/21/16 | For Sale | $318,000 | -- | $265 / Sq Ft |
| Year | Tax Paid | Tax Assessment Tax Assessment Total Assessment is a certain percentage of the fair market value that is determined by local assessors to be the total taxable value of land and additions on the property. | Land | Improvement |
|---|---|---|---|---|
| 2025 | $5,457 | $473,300 | $0 | $473,300 |
| 2024 | $5,094 | $452,000 | $0 | $452,000 |
| 2023 | $4,710 | $423,200 | $0 | $423,200 |
| 2022 | $4,830 | $403,200 | $0 | $403,200 |
| 2021 | $4,656 | $383,500 | $0 | $383,500 |
| 2020 | $4,353 | $350,200 | $0 | $350,200 |
| 2019 | $4,221 | $336,300 | $0 | $336,300 |
| 2018 | $4,161 | $311,900 | $0 | $311,900 |
| 2017 | $3,901 | $275,300 | $0 | $275,300 |
| 2016 | $3,751 | $261,200 | $0 | $261,200 |
| 2015 | $4,022 | $275,500 | $0 | $275,500 |
| 2014 | $3,896 | $262,200 | $0 | $262,200 |
J
Landlord's Agent in 2023
Jing Zheng
Keller Williams Realty
(617) 599-3169
9 in this area
129 Total Sales

Tenant's Agent in 2023
Amanda George
Lamacchia Realty, Inc.
(617) 347-0699
74 Total Sales
B
Seller's Agent in 2016
Bonnie Lai
RE/MAX
Buyer's Agent in 2016
Chris Yang
Keller Williams Realty Boston South West
(781) 414-9550
12 in this area
270 Total Sales
Source: MLS Property Information Network (MLS PIN)
MLS Number: 73065723
APN: QUIN-002085B-000116-000022-000004
Disclaimer: Certain information contained herein is derived from information provided by parties other than Homes.com. All information provided is deemed reliable, but is not guaranteed to be accurate and should be independently verified.
![]() The property listing data and information, or the Images, set forth herein were provided to MLS Property Information Network, Inc. from third party sources, including sellers, lessors and public records, and were compiled by MLS Property Information Network, Inc. The property listing data and information, and the Images, are for the personal, non-commercial use of consumers having a good faith interest in purchasing or leasing listed properties of the type displayed to them and may not be used for any purpose other than to identify prospective properties which such consumers may have a good faith interest in purchasing or leasing. MLS Property Information Network, Inc. and its subscribers disclaim any and all representations and warranties as to the accuracy of the property listing data and information, or as to the accuracy of any of the Images, set forth herein.
The property listing data and information, or the Images, set forth herein were provided to MLS Property Information Network, Inc. from third party sources, including sellers, lessors and public records, and were compiled by MLS Property Information Network, Inc. The property listing data and information, and the Images, are for the personal, non-commercial use of consumers having a good faith interest in purchasing or leasing listed properties of the type displayed to them and may not be used for any purpose other than to identify prospective properties which such consumers may have a good faith interest in purchasing or leasing. MLS Property Information Network, Inc. and its subscribers disclaim any and all representations and warranties as to the accuracy of the property listing data and information, or as to the accuracy of any of the Images, set forth herein.