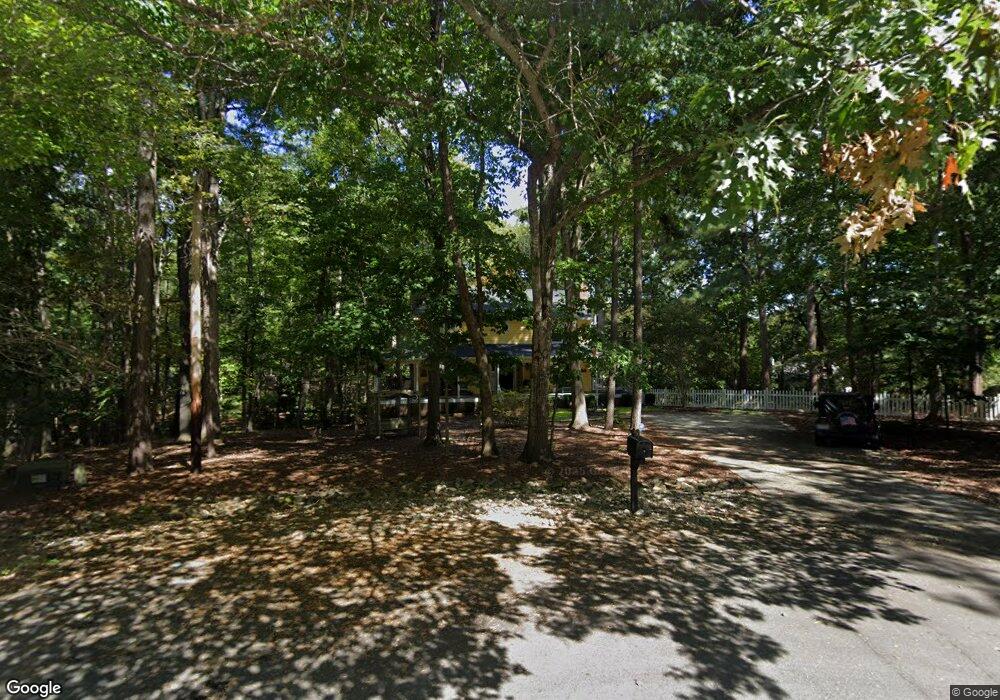
22 Sunny Oaks Place Durham, NC 27712
North Durham NeighborhoodEstimated Value: $527,376 - $604,000
4
Beds
4
Baths
2,458
Sq Ft
$229/Sq Ft
Est. Value
About This Home
This home is located at 22 Sunny Oaks Place, Durham, NC 27712 and is currently estimated at $561,844, approximately $228 per square foot. 22 Sunny Oaks Place is a home located in Durham County with nearby schools including Eno Valley Elementary, George L Carrington Middle, and Northern High School.
Ownership History
Date
Name
Owned For
Owner Type
Purchase Details
Closed on
Jun 28, 2005
Sold by
Sirva Relocation Llc
Bought by
Grant Douglas A and Grant Kathy L
Current Estimated Value
Home Financials for this Owner
Home Financials are based on the most recent Mortgage that was taken out on this home.
Original Mortgage
$135,100
Outstanding Balance
$70,524
Interest Rate
5.66%
Mortgage Type
Fannie Mae Freddie Mac
Estimated Equity
$491,320
Purchase Details
Closed on
Apr 18, 2005
Sold by
Oreilly Joseph J and Oreilly Laura V
Bought by
Sirva Relocation Llc
Home Financials for this Owner
Home Financials are based on the most recent Mortgage that was taken out on this home.
Original Mortgage
$91,000
Interest Rate
5.54%
Mortgage Type
Credit Line Revolving
Purchase Details
Closed on
Mar 12, 1998
Sold by
Marie Kozoman Sr Francis Eugene
Bought by
Oreilly Joseph J and Oreilly Laura
Home Financials for this Owner
Home Financials are based on the most recent Mortgage that was taken out on this home.
Original Mortgage
$197,370
Interest Rate
7.07%
Mortgage Type
VA
Create a Home Valuation Report for This Property
The Home Valuation Report is an in-depth analysis detailing your home's value as well as a comparison with similar homes in the area
Home Values in the Area
Average Home Value in this Area
Purchase History
| Date | Buyer | Sale Price | Title Company |
|---|---|---|---|
| Grant Douglas A | $238,000 | Stewart Title Guaranty Compa | |
| Sirva Relocation Llc | $238,000 | Stewart Title Guaranty Compa | |
| Oreilly Joseph J | $193,500 | -- |
Source: Public Records
Mortgage History
| Date | Status | Borrower | Loan Amount |
|---|---|---|---|
| Open | Grant Douglas A | $135,100 | |
| Previous Owner | Sirva Relocation Llc | $91,000 | |
| Previous Owner | Oreilly Joseph J | $197,370 |
Source: Public Records
Tax History Compared to Growth
Tax History
| Year | Tax Paid | Tax Assessment Tax Assessment Total Assessment is a certain percentage of the fair market value that is determined by local assessors to be the total taxable value of land and additions on the property. | Land | Improvement |
|---|---|---|---|---|
| 2025 | $3,449 | $490,985 | $110,625 | $380,360 |
| 2024 | $2,994 | $297,081 | $66,450 | $230,631 |
| 2023 | $2,840 | $297,081 | $66,450 | $230,631 |
| 2022 | $2,730 | $297,081 | $66,450 | $230,631 |
| 2021 | $2,517 | $297,081 | $66,450 | $230,631 |
| 2020 | $2,465 | $297,081 | $66,450 | $230,631 |
| 2019 | $2,465 | $297,081 | $66,450 | $230,631 |
| 2018 | $2,728 | $305,271 | $44,300 | $260,971 |
| 2017 | $2,697 | $305,271 | $44,300 | $260,971 |
| 2016 | $2,583 | $305,271 | $44,300 | $260,971 |
| 2015 | $2,662 | $280,443 | $51,556 | $228,887 |
| 2014 | $2,662 | $280,443 | $51,556 | $228,887 |
Source: Public Records
Map
Nearby Homes
- 2009 Eden Shire Way
- 20 Indigo Creek Trail
- 202 Brook Ln
- 2222 Umstead Rd
- 109 November Dr
- 111 November Dr
- 119 November Dr
- 4908 Mandel Rd
- 210 Accura Ct
- 5603 Ventura Dr
- 1819 Grady Dr
- 1813 Grady Dr
- 2609 Heather Glen Rd
- 5802 Lillie Dr
- 2417 Bivins Rd
- 113 Laurston Ct
- 2423 Bivins Rd
- 1139 Sawmill Ln
- 1143 Sawmill Ln
- 3015 Elk Ridge Rd
- 20 Sunny Oaks Place
- 1904 Umstead Rd
- 21 Sunny Oaks Place
- 16 Sunny Oaks Place
- 18 Trappers Ct
- 1910 Umstead Rd
- 12 Trappers Ct
- 17 Sunny Oaks Place
- 1914 Umstead Rd
- 12 Sunny Oaks Place
- 8 Trappers Ct
- 1920 Umstead Rd
- 9 Sunny Oaks Place
- 9 Trappers Ct
- 8 Sunny Oaks Place
- 212 N Riverdale Dr
- 2002 Umstead Rd
- 1 Otters Run
- 3 Sunny Oaks Place
- 218 N Riverdale Dr