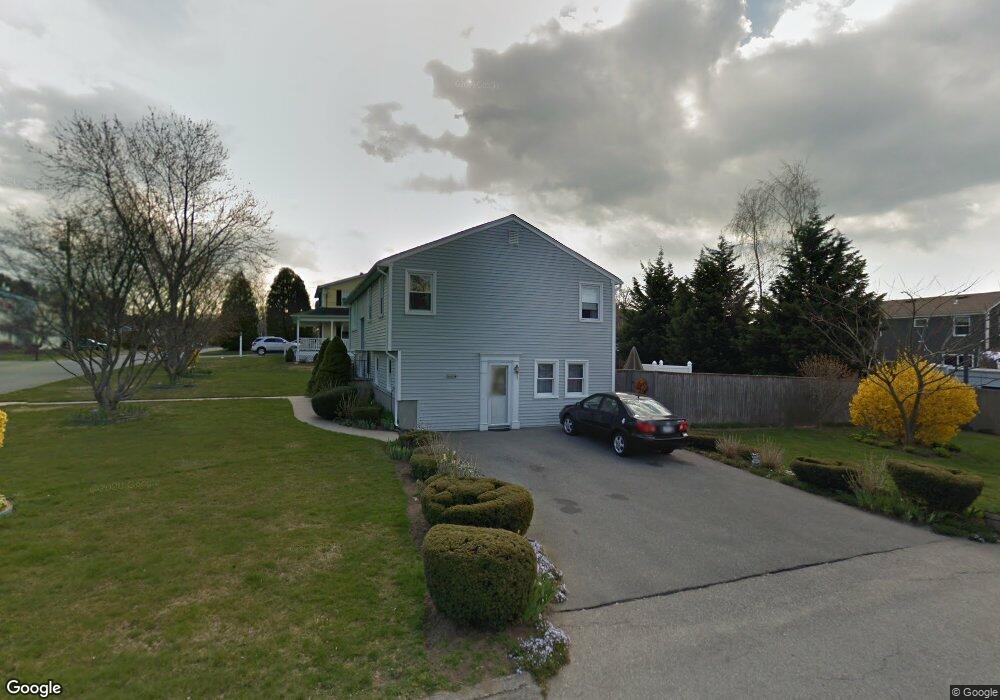
22 Taddy Ave Warren, RI 02885
North Warren NeighborhoodEstimated Value: $394,000 - $640,000
3
Beds
2
Baths
2,244
Sq Ft
$237/Sq Ft
Est. Value
About This Home
This home is located at 22 Taddy Ave, Warren, RI 02885 and is currently estimated at $532,571, approximately $237 per square foot. 22 Taddy Ave is a home located in Bristol County with nearby schools including Mt. Hope High School, Highlander Charter Middle and High School, and East Bay Career Academy.
Ownership History
Date
Name
Owned For
Owner Type
Purchase Details
Closed on
May 12, 2005
Sold by
Sobrinho Gilmar A and Sobrinho Josiane S
Bought by
Rainville Natalie and Rainville Joseph
Current Estimated Value
Home Financials for this Owner
Home Financials are based on the most recent Mortgage that was taken out on this home.
Original Mortgage
$313,500
Outstanding Balance
$165,660
Interest Rate
6.05%
Mortgage Type
Purchase Money Mortgage
Estimated Equity
$366,911
Purchase Details
Closed on
Nov 16, 1998
Sold by
Alves Jaime and Alves Maria
Bought by
Bavier John S and Bavier Kathleen
Create a Home Valuation Report for This Property
The Home Valuation Report is an in-depth analysis detailing your home's value as well as a comparison with similar homes in the area
Home Values in the Area
Average Home Value in this Area
Purchase History
| Date | Buyer | Sale Price | Title Company |
|---|---|---|---|
| Rainville Natalie | $330,000 | -- | |
| Bavier John S | $144,000 | -- |
Source: Public Records
Mortgage History
| Date | Status | Borrower | Loan Amount |
|---|---|---|---|
| Open | Bavier John S | $313,500 | |
| Previous Owner | Bavier John S | $214,000 | |
| Previous Owner | Bavier John S | $110,500 | |
| Previous Owner | Bavier John S | $40,000 |
Source: Public Records
Tax History
| Year | Tax Paid | Tax Assessment Tax Assessment Total Assessment is a certain percentage of the fair market value that is determined by local assessors to be the total taxable value of land and additions on the property. | Land | Improvement |
|---|---|---|---|---|
| 2025 | $6,525 | $438,200 | $155,100 | $283,100 |
| 2024 | $6,328 | $438,200 | $155,100 | $283,100 |
| 2023 | $5,986 | $438,200 | $155,100 | $283,100 |
| 2022 | $5,259 | $292,000 | $134,800 | $157,200 |
| 2021 | $5,247 | $296,100 | $134,800 | $161,300 |
| 2020 | $5,140 | $296,100 | $134,800 | $161,300 |
| 2019 | $5,225 | $273,400 | $125,100 | $148,300 |
| 2018 | $5,156 | $273,400 | $125,100 | $148,300 |
| 2017 | $5,143 | $273,400 | $125,100 | $148,300 |
| 2016 | $4,483 | $224,500 | $85,100 | $139,400 |
| 2015 | $4,483 | $224,500 | $85,100 | $139,400 |
| 2014 | $4,506 | $224,500 | $85,100 | $139,400 |
Source: Public Records
Map
Nearby Homes
Your Personal Tour Guide
Ask me questions while you tour the home.