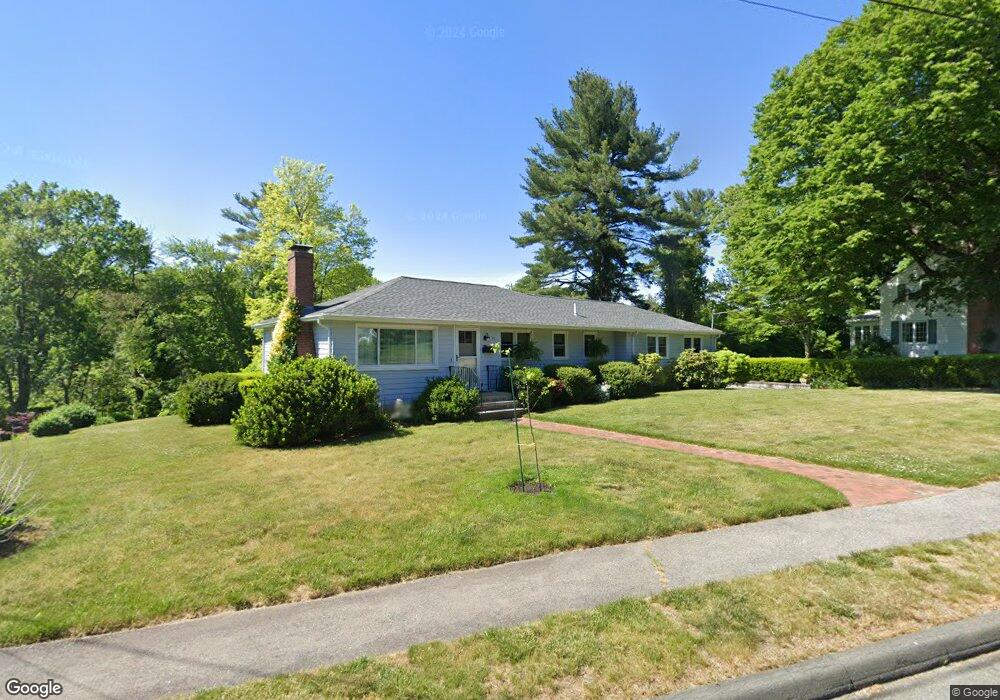
22 Temple Rd Lynnfield, MA 01940
Estimated Value: $874,000 - $979,000
3
Beds
2
Baths
1,616
Sq Ft
$566/Sq Ft
Est. Value
About This Home
This home is located at 22 Temple Rd, Lynnfield, MA 01940 and is currently estimated at $915,370, approximately $566 per square foot. 22 Temple Rd is a home located in Essex County with nearby schools including Pickering Middle School, Lynnfield High School, and Odyssey Day School.
Ownership History
Date
Name
Owned For
Owner Type
Purchase Details
Closed on
Jun 4, 2010
Sold by
Benham James J
Bought by
Benham Eileen F
Current Estimated Value
Home Financials for this Owner
Home Financials are based on the most recent Mortgage that was taken out on this home.
Original Mortgage
$320,000
Outstanding Balance
$216,037
Interest Rate
5.12%
Mortgage Type
Purchase Money Mortgage
Estimated Equity
$699,333
Purchase Details
Closed on
Apr 26, 2002
Sold by
22 Temp Rd Lynfield Rt and Schmidt Goldie H
Bought by
Benham James J and Benham Eileen F
Create a Home Valuation Report for This Property
The Home Valuation Report is an in-depth analysis detailing your home's value as well as a comparison with similar homes in the area
Home Values in the Area
Average Home Value in this Area
Purchase History
| Date | Buyer | Sale Price | Title Company |
|---|---|---|---|
| Benham Eileen F | -- | -- | |
| Benham James J | $349,200 | -- |
Source: Public Records
Mortgage History
| Date | Status | Borrower | Loan Amount |
|---|---|---|---|
| Open | Benham James J | $320,000 | |
| Previous Owner | Benham James J | $180,000 | |
| Previous Owner | Benham James J | $25,000 | |
| Previous Owner | Benham James J | $25,000 |
Source: Public Records
Tax History Compared to Growth
Tax History
| Year | Tax Paid | Tax Assessment Tax Assessment Total Assessment is a certain percentage of the fair market value that is determined by local assessors to be the total taxable value of land and additions on the property. | Land | Improvement |
|---|---|---|---|---|
| 2025 | $8,034 | $760,800 | $510,100 | $250,700 |
| 2024 | $7,688 | $731,500 | $490,400 | $241,100 |
| 2023 | $7,762 | $686,900 | $465,200 | $221,700 |
| 2022 | $7,409 | $617,900 | $427,500 | $190,400 |
| 2021 | $7,022 | $529,200 | $348,700 | $180,500 |
| 2020 | $6,863 | $493,000 | $312,500 | $180,500 |
| 2019 | $6,858 | $493,000 | $312,500 | $180,500 |
| 2018 | $6,647 | $483,100 | $312,500 | $170,600 |
| 2017 | $6,506 | $472,100 | $301,500 | $170,600 |
| 2016 | $6,051 | $417,300 | $259,000 | $158,300 |
| 2015 | $5,918 | $408,400 | $258,000 | $150,400 |
Source: Public Records
Map
Nearby Homes