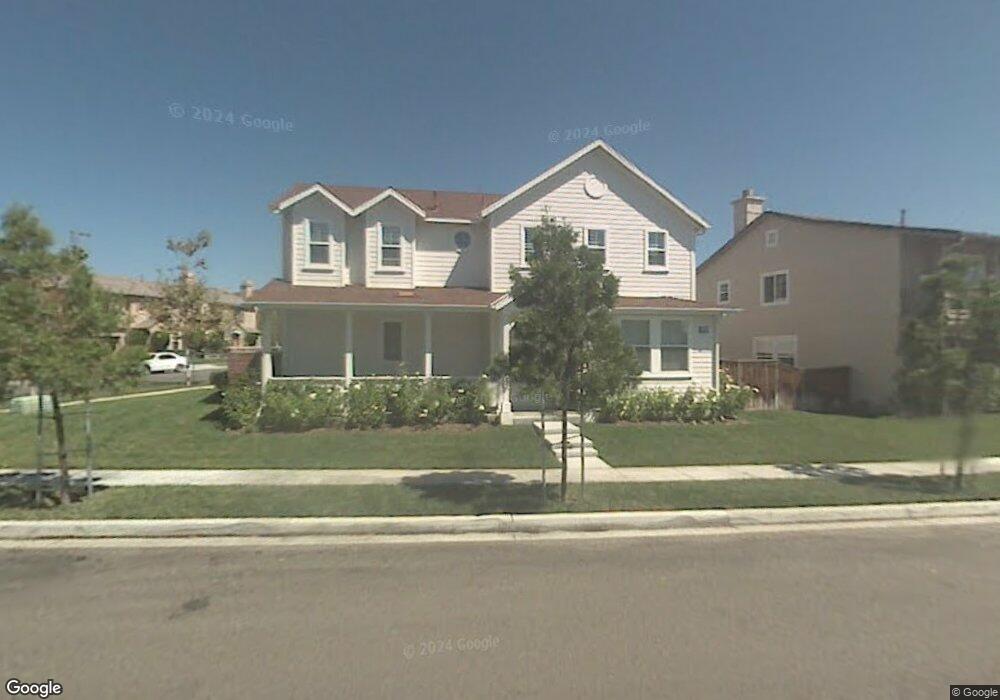
22 Terrastar Ln Ladera Ranch, CA 92694
Estimated Value: $1,458,088 - $1,518,000
3
Beds
3
Baths
2,036
Sq Ft
$732/Sq Ft
Est. Value
About This Home
This home is located at 22 Terrastar Ln, Ladera Ranch, CA 92694 and is currently estimated at $1,490,522, approximately $732 per square foot. 22 Terrastar Ln is a home located in Orange County with nearby schools including Ladera Ranch Elementary School, Ladera Ranch Middle School, and San Juan Hills High School.
Ownership History
Date
Name
Owned For
Owner Type
Purchase Details
Closed on
Apr 9, 2014
Sold by
Owen Gary A and Wu Ching Fan
Bought by
Hanreich Andreas K and Hanreich Fumiko
Current Estimated Value
Home Financials for this Owner
Home Financials are based on the most recent Mortgage that was taken out on this home.
Original Mortgage
$417,100
Outstanding Balance
$317,551
Interest Rate
4.38%
Mortgage Type
New Conventional
Estimated Equity
$1,172,971
Purchase Details
Closed on
Oct 23, 2002
Sold by
Centex Homes
Bought by
Wu Ching Fan and Owen Gary A
Home Financials for this Owner
Home Financials are based on the most recent Mortgage that was taken out on this home.
Original Mortgage
$340,298
Interest Rate
6.03%
Create a Home Valuation Report for This Property
The Home Valuation Report is an in-depth analysis detailing your home's value as well as a comparison with similar homes in the area
Home Values in the Area
Average Home Value in this Area
Purchase History
| Date | Buyer | Sale Price | Title Company |
|---|---|---|---|
| Hanreich Andreas K | $720,000 | Western Resources Title Co | |
| Wu Ching Fan | $434,000 | Commerce Title Company |
Source: Public Records
Mortgage History
| Date | Status | Borrower | Loan Amount |
|---|---|---|---|
| Open | Hanreich Andreas K | $417,100 | |
| Previous Owner | Wu Ching Fan | $340,298 | |
| Closed | Wu Ching Fan | $50,000 |
Source: Public Records
Tax History
| Year | Tax Paid | Tax Assessment Tax Assessment Total Assessment is a certain percentage of the fair market value that is determined by local assessors to be the total taxable value of land and additions on the property. | Land | Improvement |
|---|---|---|---|---|
| 2025 | $11,002 | $882,616 | $598,913 | $283,703 |
| 2024 | $11,002 | $865,310 | $587,169 | $278,141 |
| 2023 | $10,812 | $848,344 | $575,656 | $272,688 |
| 2022 | $10,610 | $831,710 | $564,368 | $267,342 |
| 2021 | $10,438 | $815,402 | $553,302 | $262,100 |
| 2020 | $10,291 | $807,042 | $547,629 | $259,413 |
| 2019 | $10,418 | $791,218 | $536,891 | $254,327 |
| 2018 | $10,356 | $775,704 | $526,363 | $249,341 |
| 2017 | $10,455 | $760,495 | $516,043 | $244,452 |
| 2016 | $10,345 | $745,584 | $505,925 | $239,659 |
| 2015 | $10,341 | $734,385 | $498,325 | $236,060 |
| 2014 | $7,985 | $512,362 | $304,310 | $208,052 |
Source: Public Records
Map
Nearby Homes
- 30 Savannah Ln
- 9 Three Vines Ct
- 146 Main St
- 12 Roycroft Ct
- 10 Roycroft Ct
- 9 Paverstone Ln
- 2 Aryshire Ln
- 129 Sklar St Unit 34
- 15 Whitworth St
- 19 Vinca Ct
- 518 Afterglow Dr
- 1 Flowerdale
- 28 Albany St Unit 77
- 5 Dietes Ct Unit 131
- 201 Sklar St
- 27 Dietes Ct
- 81 Zinnia St
- 346 Hazel Dr
- 18811 Volta Rd
- 5104 Solace Dr
- 24 Terrastar Ln
- 26 Terrastar Ln
- 18 Terrastar Ln
- 7 Bellflower St
- 10 Tether Moon Ln
- 33 Capricorn Dr
- 15 Tether Moon Ln
- 11 Bellflower St
- 28 Terrastar Ln
- 16 Terrastar Ln
- 8 Tether Moon Ln
- 31 Capricorn Dr
- 90 Capricorn Dr
- 9 Tether Moon Ln
- 27 Terrastar Ln
- 5 Sweet Pea St
- 17 Bellflower St
- 30 Terrastar Ln
- 14 Terrastar Ln
- 6 Tether Moon Ln
Your Personal Tour Guide
Ask me questions while you tour the home.