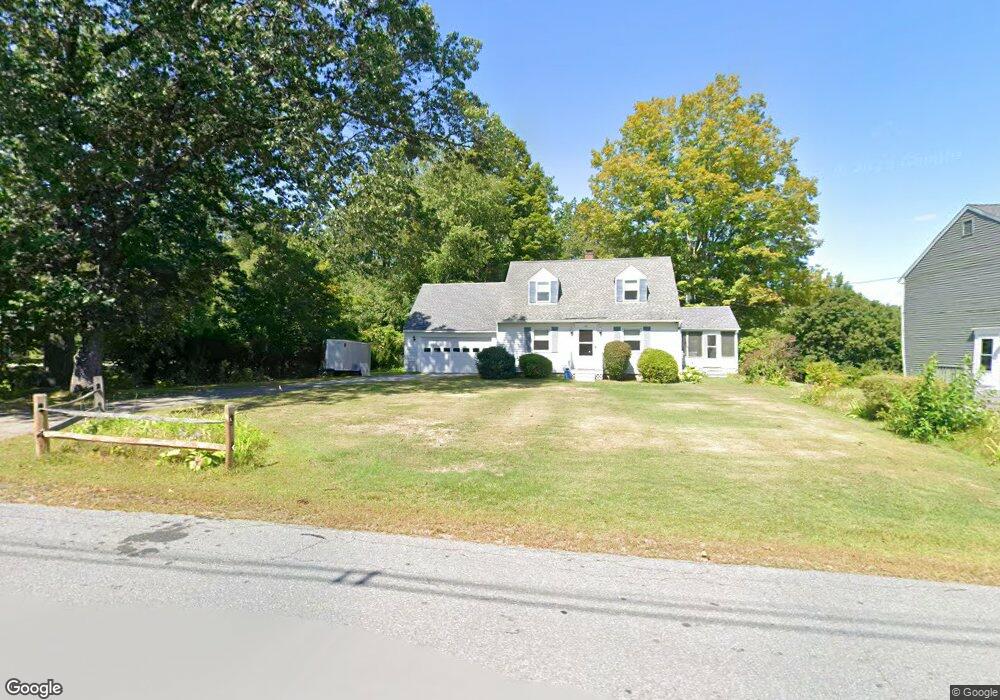
22 Tucker St Pepperell, MA 01463
Estimated Value: $398,000 - $509,000
3
Beds
2
Baths
1,502
Sq Ft
$298/Sq Ft
Est. Value
About This Home
This home is located at 22 Tucker St, Pepperell, MA 01463 and is currently estimated at $446,926, approximately $297 per square foot. 22 Tucker St is a home located in Middlesex County with nearby schools including North Middlesex Regional High School, Pepperell Christian Academy, and Maple Dene & Moppet School.
Ownership History
Date
Name
Owned For
Owner Type
Purchase Details
Closed on
Jul 17, 1998
Sold by
Pallies Michael J and Pallies Patricia M
Bought by
Carroll Michael E and Carroll Donna J
Current Estimated Value
Home Financials for this Owner
Home Financials are based on the most recent Mortgage that was taken out on this home.
Original Mortgage
$130,410
Interest Rate
6.98%
Mortgage Type
Purchase Money Mortgage
Create a Home Valuation Report for This Property
The Home Valuation Report is an in-depth analysis detailing your home's value as well as a comparison with similar homes in the area
Home Values in the Area
Average Home Value in this Area
Purchase History
| Date | Buyer | Sale Price | Title Company |
|---|---|---|---|
| Carroll Michael E | $144,900 | -- |
Source: Public Records
Mortgage History
| Date | Status | Borrower | Loan Amount |
|---|---|---|---|
| Open | Carroll Michael E | $127,000 | |
| Closed | Carroll Michael E | $130,410 | |
| Previous Owner | Carroll Michael E | $126,584 |
Source: Public Records
Tax History Compared to Growth
Tax History
| Year | Tax Paid | Tax Assessment Tax Assessment Total Assessment is a certain percentage of the fair market value that is determined by local assessors to be the total taxable value of land and additions on the property. | Land | Improvement |
|---|---|---|---|---|
| 2025 | $4,913 | $335,800 | $113,600 | $222,200 |
| 2024 | $4,819 | $335,800 | $113,600 | $222,200 |
| 2023 | $4,609 | $304,400 | $95,700 | $208,700 |
| 2022 | $4,485 | $261,500 | $95,700 | $165,800 |
| 2021 | $4,394 | $245,200 | $83,700 | $161,500 |
| 2020 | $10,340 | $239,100 | $83,700 | $155,400 |
| 2019 | $7,523 | $231,000 | $83,700 | $147,300 |
| 2018 | $4,590 | $223,100 | $83,700 | $139,400 |
| 2017 | $4,297 | $214,500 | $77,700 | $136,800 |
| 2016 | $3,285 | $198,700 | $77,700 | $121,000 |
| 2015 | $3,059 | $191,800 | $77,700 | $114,100 |
| 2014 | $2,676 | $168,700 | $59,800 | $108,900 |
Source: Public Records
Map
Nearby Homes
- 8 Tucker Park Unit D
- 10 Tucker St
- 28-30 Groton St
- 9 Tarbell St
- 31 Prospect St
- 38 Tarbell St Unit 5B
- 11 Shawnee Rd
- 38 River Rd Unit 11
- 23 Shawnee Rd Unit 23
- 16 Village Rd
- 46 Lowell Rd
- 80A Nashua Rd
- 55 Park St
- 102A Nashua Rd
- 573 Longley Rd
- 31 Heald St
- 2 Old Farm Ln
- 5 June St
- 13 Oak Hill St
- 6 Mason St Unit 31
- 24A Tucker St
- 24B Tucker St Unit 24 B
- 24B Tucker St
- 24B Tucker St Unit B
- 18A Tucker St Unit 1
- 18 Tucker St Unit 4
- 18 Tucker St Unit 3
- 18 Tucker St Unit 2
- 18 Tucker St Unit 1
- 18 Tucker St
- 18-20 Tucker St
- 18 Tucker St Unit D
- 18 Tucker St Unit C
- 18 Tucker St Unit A
- 24 Tucker St Unit D
- 24 Tucker St Unit C
- 24 Tucker St Unit B
- 2A Tucker Park
- 2B Tucker Park
- 2 Tucker Park Unit B