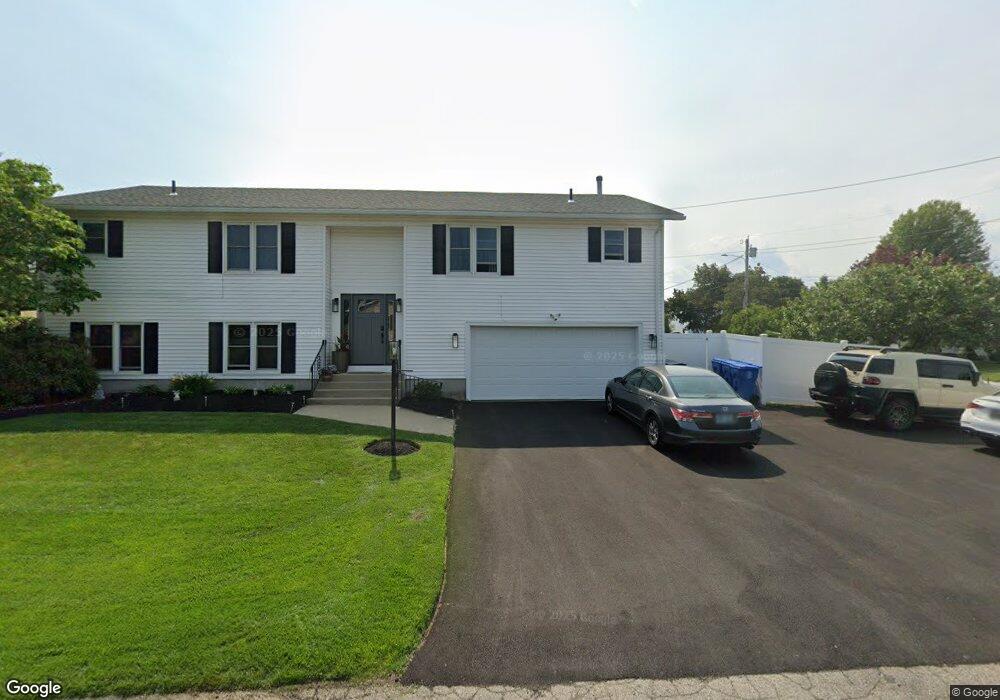
22 Tudor St Cranston, RI 02920
Budlong NeighborhoodEstimated Value: $541,000 - $614,000
4
Beds
3
Baths
1,776
Sq Ft
$319/Sq Ft
Est. Value
About This Home
This home is located at 22 Tudor St, Cranston, RI 02920 and is currently estimated at $566,000, approximately $318 per square foot. 22 Tudor St is a home located in Providence County with nearby schools including Woodridge Elementary School, Western Hills Middle School, and Cranston High School West.
Ownership History
Date
Name
Owned For
Owner Type
Purchase Details
Closed on
Jan 16, 2026
Sold by
Julia J Dilorio Irt and Morello
Bought by
Morello Michele S
Current Estimated Value
Purchase Details
Closed on
Oct 26, 2022
Sold by
Mary K Simeone Irt and Morello
Bought by
Morello Michele S
Purchase Details
Closed on
Jan 14, 2013
Sold by
Julia J Diiorio Ret and Diiorio
Bought by
Julia J Diiorio Irt and Morello
Purchase Details
Closed on
May 25, 2012
Sold by
Mary L Simeone Ret and Simeone
Bought by
Mary L Simeone Irt T L and Mary Morello
Create a Home Valuation Report for This Property
The Home Valuation Report is an in-depth analysis detailing your home's value as well as a comparison with similar homes in the area
Home Values in the Area
Average Home Value in this Area
Purchase History
| Date | Buyer | Sale Price | Title Company |
|---|---|---|---|
| Morello Michele S | -- | -- | |
| Morello Michele S | -- | None Available | |
| Julia J Diiorio Irt | -- | -- | |
| Mary L Simeone Irt T L | -- | -- |
Source: Public Records
Mortgage History
| Date | Status | Borrower | Loan Amount |
|---|---|---|---|
| Previous Owner | Mary L Simeone Irt T L | $100,000 |
Source: Public Records
Tax History
| Year | Tax Paid | Tax Assessment Tax Assessment Total Assessment is a certain percentage of the fair market value that is determined by local assessors to be the total taxable value of land and additions on the property. | Land | Improvement |
|---|---|---|---|---|
| 2025 | $6,642 | $478,500 | $110,800 | $367,700 |
| 2024 | $6,512 | $478,500 | $110,800 | $367,700 |
| 2023 | $5,867 | $310,400 | $73,000 | $237,400 |
| 2022 | $5,746 | $310,400 | $73,000 | $237,400 |
| 2021 | $5,587 | $310,400 | $73,000 | $237,400 |
| 2020 | $5,492 | $264,400 | $69,500 | $194,900 |
| 2019 | $5,492 | $264,400 | $69,500 | $194,900 |
| 2018 | $5,365 | $264,400 | $69,500 | $194,900 |
| 2017 | $5,042 | $219,800 | $62,500 | $157,300 |
| 2016 | $4,935 | $219,800 | $62,500 | $157,300 |
| 2015 | $4,935 | $219,800 | $62,500 | $157,300 |
| 2014 | $3,796 | $189,700 | $62,500 | $127,200 |
Source: Public Records
Map
Nearby Homes
Your Personal Tour Guide
Ask me questions while you tour the home.