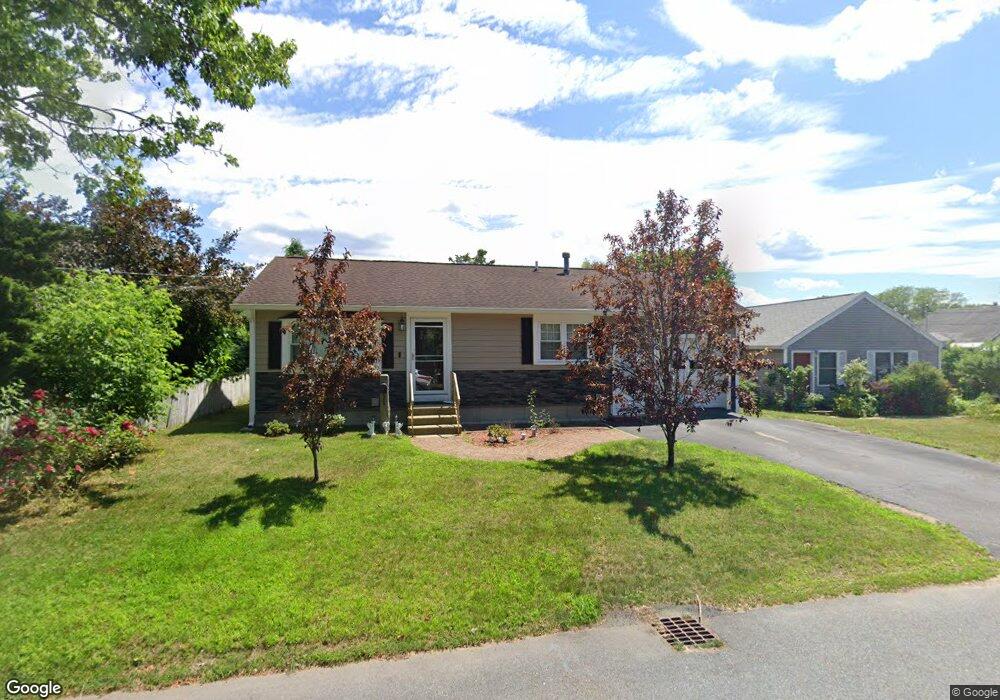
22 Underhill St Nashua, NH 03060
Downtown Nashua NeighborhoodEstimated Value: $415,000 - $457,000
2
Beds
1
Bath
896
Sq Ft
$480/Sq Ft
Est. Value
About This Home
This home is located at 22 Underhill St, Nashua, NH 03060 and is currently estimated at $430,106, approximately $480 per square foot. 22 Underhill St is a home located in Hillsborough County with nearby schools including Dr. Norman W. Crisp Elementary School, Elm Street Middle School, and Nashua High School North.
Ownership History
Date
Name
Owned For
Owner Type
Purchase Details
Closed on
Mar 13, 2006
Sold by
Tarasiak Robert J and Tarasiak Mariana M
Bought by
Pacheco Domingo and Pacheco Judith
Current Estimated Value
Home Financials for this Owner
Home Financials are based on the most recent Mortgage that was taken out on this home.
Original Mortgage
$194,400
Outstanding Balance
$109,737
Interest Rate
6.15%
Mortgage Type
Purchase Money Mortgage
Estimated Equity
$320,369
Purchase Details
Closed on
Mar 3, 1999
Sold by
Gauthier Raymond R
Bought by
Tarasiak Robert J and Tarasiak Mariana M
Home Financials for this Owner
Home Financials are based on the most recent Mortgage that was taken out on this home.
Original Mortgage
$121,380
Interest Rate
6.76%
Mortgage Type
Purchase Money Mortgage
Purchase Details
Closed on
Jan 24, 1996
Sold by
Valcourt Edward O
Bought by
Gauthier Raymond R
Create a Home Valuation Report for This Property
The Home Valuation Report is an in-depth analysis detailing your home's value as well as a comparison with similar homes in the area
Home Values in the Area
Average Home Value in this Area
Purchase History
| Date | Buyer | Sale Price | Title Company |
|---|---|---|---|
| Pacheco Domingo | $243,000 | -- | |
| Tarasiak Robert J | $119,000 | -- | |
| Gauthier Raymond R | $86,000 | -- |
Source: Public Records
Mortgage History
| Date | Status | Borrower | Loan Amount |
|---|---|---|---|
| Open | Gauthier Raymond R | $194,400 | |
| Previous Owner | Gauthier Raymond R | $176,000 | |
| Previous Owner | Gauthier Raymond R | $15,000 | |
| Previous Owner | Gauthier Raymond R | $121,380 |
Source: Public Records
Tax History Compared to Growth
Tax History
| Year | Tax Paid | Tax Assessment Tax Assessment Total Assessment is a certain percentage of the fair market value that is determined by local assessors to be the total taxable value of land and additions on the property. | Land | Improvement |
|---|---|---|---|---|
| 2024 | $6,238 | $392,300 | $143,800 | $248,500 |
| 2023 | $6,010 | $329,700 | $115,000 | $214,700 |
| 2022 | $5,958 | $329,700 | $115,000 | $214,700 |
| 2021 | $5,245 | $225,900 | $76,700 | $149,200 |
| 2020 | $5,090 | $225,100 | $76,700 | $148,400 |
| 2019 | $4,898 | $225,100 | $76,700 | $148,400 |
| 2018 | $4,774 | $225,100 | $76,700 | $148,400 |
| 2017 | $4,271 | $165,600 | $66,300 | $99,300 |
| 2016 | $4,152 | $165,600 | $66,300 | $99,300 |
| 2015 | $4,062 | $165,600 | $66,300 | $99,300 |
| 2014 | $3,983 | $165,600 | $66,300 | $99,300 |
Source: Public Records
Map
Nearby Homes
- 24 Underhill St
- 26 Underhill St
- 26 Underhill St Unit 1
- 80 Burke St
- 29 Underhill St
- 28 Underhill St Unit 290
- 23 Underhill St Unit 321
- 31 Underhill St
- 34 Underhill St
- 86 Burke St
- 78 Burke St Unit 296297A
- 88 Burke St Unit 90
- 18 Underhill St
- 76 Burke St
- 35 Underhill St
- 92 Burke St Unit 94
- 74 Burke St Unit U300A
- 92 Burke St
- 17 Underhill St Unit 314
- 63 King St