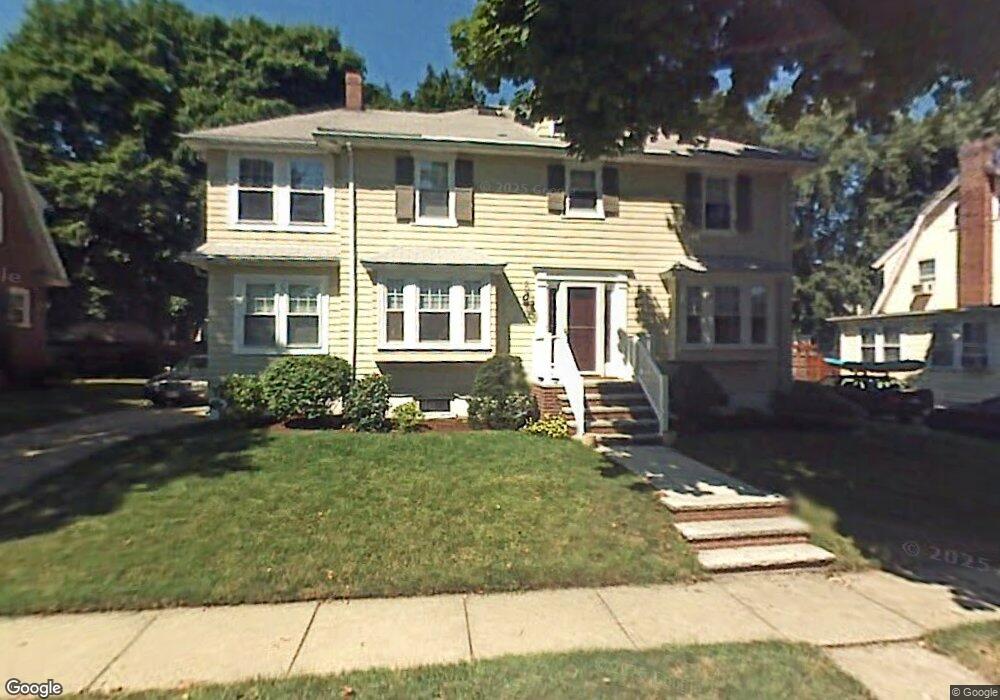
22 Van Ness Rd Belmont, MA 02478
Cushing Square NeighborhoodEstimated Value: $1,413,000 - $1,609,000
3
Beds
3
Baths
2,145
Sq Ft
$718/Sq Ft
Est. Value
About This Home
This home is located at 22 Van Ness Rd, Belmont, MA 02478 and is currently estimated at $1,540,739, approximately $718 per square foot. 22 Van Ness Rd is a home located in Middlesex County with nearby schools including Roger Wellington Elementary School, Winthrop L Chenery Middle School, and Belmont High School.
Ownership History
Date
Name
Owned For
Owner Type
Purchase Details
Closed on
Apr 21, 2021
Sold by
Cellucci Anthony G and Busa-Cellucci Deborah M
Bought by
Anthony G Cellucci Ft
Current Estimated Value
Purchase Details
Closed on
May 24, 1993
Sold by
Newton South Coop Bk
Bought by
Alibrandi Mark W and Alibrandi Martina N
Home Financials for this Owner
Home Financials are based on the most recent Mortgage that was taken out on this home.
Original Mortgage
$196,500
Interest Rate
7.54%
Mortgage Type
Purchase Money Mortgage
Create a Home Valuation Report for This Property
The Home Valuation Report is an in-depth analysis detailing your home's value as well as a comparison with similar homes in the area
Home Values in the Area
Average Home Value in this Area
Purchase History
| Date | Buyer | Sale Price | Title Company |
|---|---|---|---|
| Anthony G Cellucci Ft | -- | None Available | |
| Cellucci Anthony G | -- | None Available | |
| Alibrandi Mark W | $258,500 | -- |
Source: Public Records
Mortgage History
| Date | Status | Borrower | Loan Amount |
|---|---|---|---|
| Previous Owner | Alibrandi Mark W | $222,700 | |
| Previous Owner | Alibrandi Mark W | $50,000 | |
| Previous Owner | Alibrandi Mark W | $196,500 | |
| Previous Owner | Alibrandi Mark W | $264,000 |
Source: Public Records
Tax History
| Year | Tax Paid | Tax Assessment Tax Assessment Total Assessment is a certain percentage of the fair market value that is determined by local assessors to be the total taxable value of land and additions on the property. | Land | Improvement |
|---|---|---|---|---|
| 2025 | $16,618 | $1,459,000 | $751,000 | $708,000 |
| 2024 | $15,270 | $1,446,000 | $889,000 | $557,000 |
| 2023 | $15,118 | $1,345,000 | $839,000 | $506,000 |
| 2022 | $14,346 | $1,241,000 | $768,000 | $473,000 |
| 2021 | $15,614 | $1,353,000 | $960,000 | $393,000 |
| 2020 | $13,354 | $1,214,000 | $821,000 | $393,000 |
| 2019 | $11,483 | $984,000 | $621,000 | $363,000 |
| 2018 | $11,275 | $928,000 | $565,000 | $363,000 |
| 2017 | $10,901 | $859,000 | $496,000 | $363,000 |
| 2016 | $10,751 | $856,000 | $496,000 | $360,000 |
| 2015 | $10,139 | $786,000 | $427,000 | $359,000 |
Source: Public Records
Map
Nearby Homes
- 12 Carver Rd
- 29 Commonwealth Rd Unit 1
- 7-9 Clyde Rd
- 10 Clyde Rd Unit 10-1
- 10-12 Clyde Rd Unit 1
- 147 Langdon Ave Unit 1
- 354 School St Unit 354
- 182 Maplewood St Unit 2
- 75 Foster Rd Unit 1
- 73 Foster Rd Unit 2
- 210 Belmont St Unit 13
- 210 Belmont St Unit 2
- 198 Belmont St Unit 1
- 519 Belmont St
- 519 Belmont St Unit 2
- 30 Unity Ave Unit 30
- 46 Maplewood St Unit 2
- 19 Keith St Unit 2
- 6 Appleton St Unit 2
- 125 Trapelo Rd Unit 21
Your Personal Tour Guide
Ask me questions while you tour the home.