22 Vanessa Dr SE Unit 8 Smyrna, GA 30082
Estimated payment $2,630/month
Highlights
- River View
- Deck
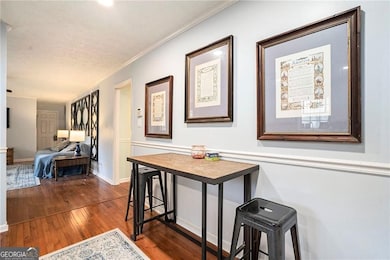
- Wood Flooring
- King Springs Elementary School Rated A
- 2-Story Property
- Solid Surface Countertops
About This Home
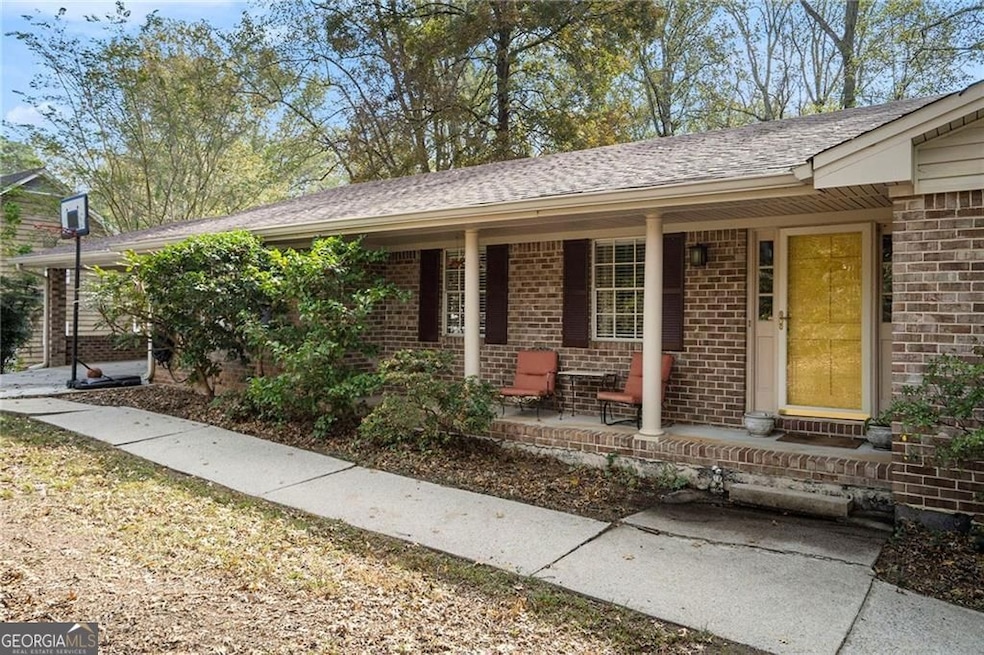
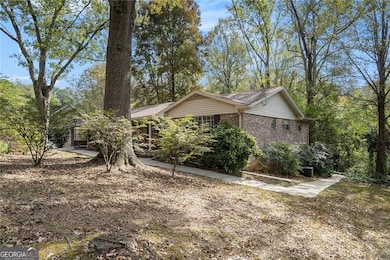
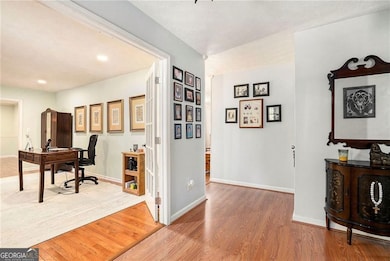
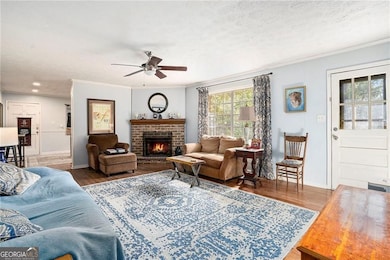
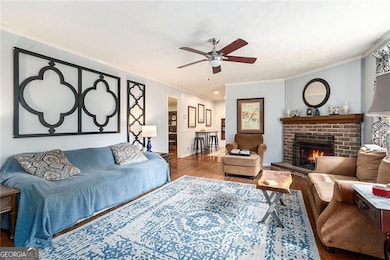
Discover 22 Vanessa Drive in Concord Village, Smyrna! This 4-sided brick, 4-bedroom, 3-bath home offers a perfect blend of space, style, and flexibility. The main kitchen features ample cabinets and a practical layout for everyday living and entertaining. The finished basement is wired for a fully functional kitchen, making it ideal as a basement apartment, in-law suite, or Airbnb, adding incredible income potential or extra living space. A brand-new pump with lifetime warranty ensures worry-free living. Enjoy the beautifully landscaped backyard, perfect for gatherings or relaxing evenings. Located in the sought-after Concord Village neighborhood, you're just minutes from Campbell High, Truist Park/The Battery, Cumberland Mall, shopping, dining, and I-75 & I-285. Experience the convenience of Smyrna living, a strong community, and versatile spaces in one exceptional home!
Listing Agent
BHGRE Metro Brokers Brokerage Phone: License #406979 Listed on: 10/27/2025

Home Details
Home Type
- Single Family
Est. Annual Taxes
- $4,306
Year Built
- Built in 1973
Lot Details
- 10,454 Sq Ft Lot
- Fenced
Property Views
- River
- Seasonal
Home Design
- 2-Story Property
- Traditional Architecture
- Brick Exterior Construction
- Slab Foundation
- Composition Roof
Interior Spaces
- Gas Log Fireplace
- Double Pane Windows
- Family Room with Fireplace
- Den
- Fire and Smoke Detector
Kitchen
- Dishwasher
- Kitchen Island
- Solid Surface Countertops
Flooring
- Wood
- Carpet
- Laminate
Bedrooms and Bathrooms
Finished Basement
- Basement Fills Entire Space Under The House
- Interior and Exterior Basement Entry
- Laundry in Basement
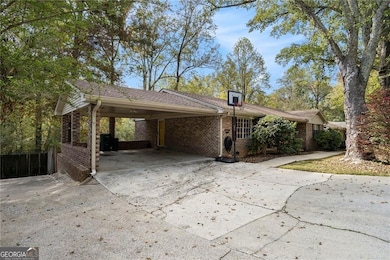
Parking
- 2 Parking Spaces
- Carport
Outdoor Features
- Deck
Schools
- King Springs Elementary School
- Griffin Middle School
- Campbell High School
Utilities
- Central Air
- Heating System Uses Natural Gas
- 220 Volts
- Gas Water Heater
- Phone Available
- Cable TV Available
Community Details
- No Home Owners Association
- Concord Village Subdivision
Listing and Financial Details
- Legal Lot and Block 15 / 3
Map
Home Values in the Area
Average Home Value in this Area
Tax History
| Year | Tax Paid | Tax Assessment Tax Assessment Total Assessment is a certain percentage of the fair market value that is determined by local assessors to be the total taxable value of land and additions on the property. | Land | Improvement |
|---|---|---|---|---|
| 2025 | $4,306 | $181,980 | $40,000 | $141,980 |
| 2024 | $4,310 | $181,980 | $40,000 | $141,980 |
| 2023 | $2,982 | $145,768 | $32,000 | $113,768 |
| 2022 | $3,213 | $130,312 | $26,000 | $104,312 |
| 2021 | $2,866 | $114,440 | $26,000 | $88,440 |
| 2020 | $2,680 | $105,964 | $26,000 | $79,964 |
| 2019 | $2,440 | $94,968 | $24,000 | $70,968 |
| 2018 | $2,440 | $94,968 | $24,000 | $70,968 |
| 2017 | $1,921 | $75,968 | $20,800 | $55,168 |
| 2016 | $1,922 | $75,968 | $20,800 | $55,168 |
| 2015 | $1,754 | $68,384 | $20,800 | $47,584 |
| 2014 | $1,689 | $65,696 | $0 | $0 |
Property History
| Date | Event | Price | List to Sale | Price per Sq Ft |
|---|---|---|---|---|
| 10/27/2025 10/27/25 | For Sale | $430,000 | -- | $159 / Sq Ft |
Purchase History
| Date | Type | Sale Price | Title Company |
|---|---|---|---|
| Interfamily Deed Transfer | -- | Esl Title & Settlement Svcs | |
| Deed | $221,000 | -- | |
| Deed | $110,000 | -- |
Mortgage History
| Date | Status | Loan Amount | Loan Type |
|---|---|---|---|
| Open | $220,500 | New Conventional | |
| Closed | $221,000 | New Conventional | |
| Closed | $0 | No Value Available |
Source: Georgia MLS
MLS Number: 10625815
APN: 17-0239-0-021-0
Disclaimer: Certain information contained herein is derived from information provided by parties other than Homes.com. All information provided is deemed reliable, but is not guaranteed to be accurate and should be independently verified.
![]() The data relating to real estate for sale on this web site comes in part from the Broker Reciprocity Program of Georgia MLS. Real estate listings held by brokerage firms other than Redfin are marked with the Broker Reciprocity logo and detailed information about them includes the name of the listing brokers. Information deemed reliable but not guaranteed. Copyright 2025 Georgia MLS. All rights reserved.
The data relating to real estate for sale on this web site comes in part from the Broker Reciprocity Program of Georgia MLS. Real estate listings held by brokerage firms other than Redfin are marked with the Broker Reciprocity logo and detailed information about them includes the name of the listing brokers. Information deemed reliable but not guaranteed. Copyright 2025 Georgia MLS. All rights reserved.
- 3664 Nessa Ct SE
- 88 Lucia Dr SE Unit 5
- 118 Lucia Dr SE
- 14 Geraldine Dr SE
- 22 Geraldine Dr SE
- 18 Geraldine Dr SE
- 63 Geraldine Dr SE
- 166 Hurt Dr SE
- 3808 Concord Approach Way SE
- 169 Hurt Dr SE
- 317 Highview Dr SE
- 524 Tackett Farms Rd
- 1375 Mosswood Ln SE
- 3418 Creek Valley Dr SE
- 321 Covered Bridge Place SW
- 362 Doeskin Ln SE
- 436 Concord Rd SE
- 117 Radford Cir SW
- 3780 Dora Dr SE
- 145 Melinda Way SE
- 153 Melinda Way SE
- 300 Hurt Rd SE
- 295 Plantation Rd SW
- 300 Hurt Rd SE Unit 2406
- 300 Hurt Rd SE Unit 2607
- 367 Autumn Ln SE
- 1375 Mosswood Ln SE
- 3390 Creek Valley Dr SE
- 425 Plantation Rd SW Unit ID1234811P
- 425 Plantation Rd SW
- 3235 Woodview Dr SE
- 3435 Alexander Place SW
- 107 Huntwood Dr SE
- 404 Willowbrook Ct SE
- 3325 Hidden Trail Rd SE
- 3038 Courtney Dr SW
- 811 Park Manor Dr SE
- 536 Cresentry Brook