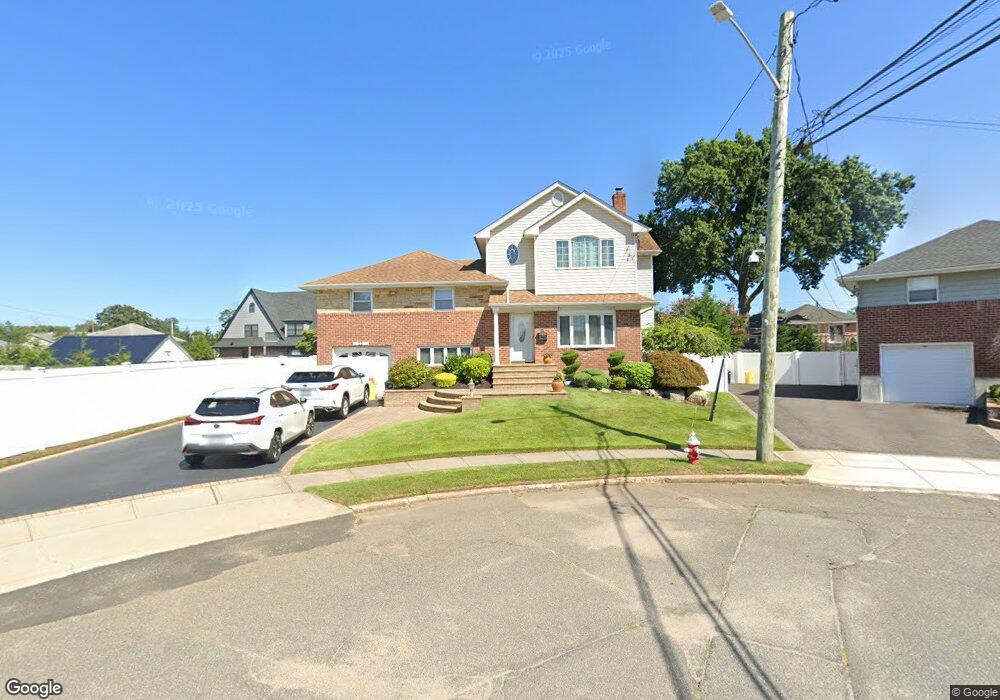
22 Verly Ct Bethpage, NY 11714
Estimated Value: $865,366 - $918,000
--
Bed
3
Baths
2,015
Sq Ft
$443/Sq Ft
Est. Value
About This Home
This home is located at 22 Verly Ct, Bethpage, NY 11714 and is currently estimated at $891,683, approximately $442 per square foot. 22 Verly Ct is a home located in Nassau County with nearby schools including John H. West Elementary School, Plainedge Middle School, and Plainedge Senior High School.
Ownership History
Date
Name
Owned For
Owner Type
Purchase Details
Closed on
Feb 26, 2003
Sold by
Eng George
Current Estimated Value
Purchase Details
Closed on
Aug 21, 2002
Sold by
Alfano Joseph
Bought by
Eng George
Purchase Details
Closed on
Sep 20, 1999
Sold by
Fritz Josephine
Bought by
Alfano Joseph V and Alfano Denise
Home Financials for this Owner
Home Financials are based on the most recent Mortgage that was taken out on this home.
Original Mortgage
$190,000
Interest Rate
7.85%
Mortgage Type
Purchase Money Mortgage
Create a Home Valuation Report for This Property
The Home Valuation Report is an in-depth analysis detailing your home's value as well as a comparison with similar homes in the area
Home Values in the Area
Average Home Value in this Area
Purchase History
| Date | Buyer | Sale Price | Title Company |
|---|---|---|---|
| -- | -- | -- | |
| Eng George | $380,000 | -- | |
| Alfano Joseph V | $238,000 | -- |
Source: Public Records
Mortgage History
| Date | Status | Borrower | Loan Amount |
|---|---|---|---|
| Previous Owner | Alfano Joseph V | $190,000 |
Source: Public Records
Tax History Compared to Growth
Tax History
| Year | Tax Paid | Tax Assessment Tax Assessment Total Assessment is a certain percentage of the fair market value that is determined by local assessors to be the total taxable value of land and additions on the property. | Land | Improvement |
|---|---|---|---|---|
| 2025 | $18,646 | $576 | $248 | $328 |
| 2024 | $5,400 | $590 | $254 | $336 |
| 2023 | $17,288 | $613 | $264 | $349 |
| 2022 | $17,288 | $613 | $264 | $349 |
| 2021 | $16,335 | $615 | $236 | $379 |
| 2020 | $15,800 | $817 | $535 | $282 |
| 2019 | $17,663 | $875 | $537 | $338 |
| 2018 | $17,675 | $934 | $0 | $0 |
| 2017 | $12,948 | $992 | $460 | $532 |
| 2016 | $18,045 | $1,051 | $487 | $564 |
| 2015 | $5,603 | $1,236 | $573 | $663 |
| 2014 | $5,603 | $1,236 | $573 | $663 |
| 2013 | $3,926 | $955 | $573 | $382 |
Source: Public Records
Map
Nearby Homes