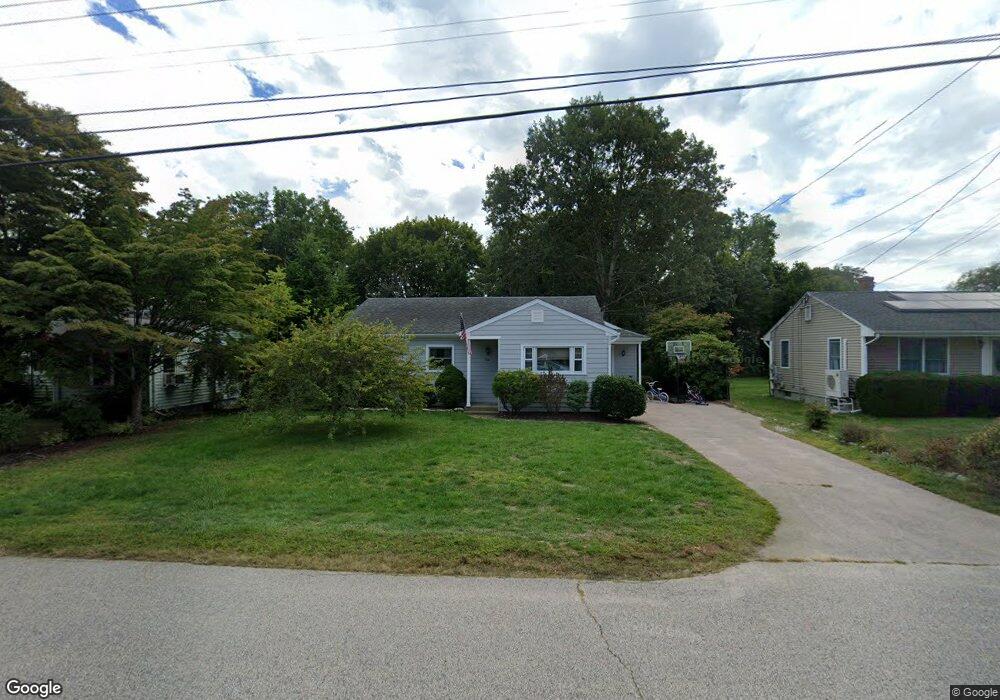
22 W Arch St Pawcatuck, CT 06379
Estimated Value: $379,000 - $432,000
3
Beds
3
Baths
1,529
Sq Ft
$265/Sq Ft
Est. Value
About This Home
This home is located at 22 W Arch St, Pawcatuck, CT 06379 and is currently estimated at $405,670, approximately $265 per square foot. 22 W Arch St is a home located in New London County with nearby schools including Stonington Middle School, Stonington High School, and North Stonington Christian Academy.
Ownership History
Date
Name
Owned For
Owner Type
Purchase Details
Closed on
Dec 13, 2016
Sold by
Est Orr Catherine M and Orr James C
Bought by
Servideo Paul E and Servideo Adrienne B
Current Estimated Value
Home Financials for this Owner
Home Financials are based on the most recent Mortgage that was taken out on this home.
Original Mortgage
$176,000
Outstanding Balance
$143,519
Interest Rate
3.47%
Mortgage Type
Purchase Money Mortgage
Estimated Equity
$262,151
Purchase Details
Closed on
Apr 11, 1963
Bought by
Orr Catherine M
Create a Home Valuation Report for This Property
The Home Valuation Report is an in-depth analysis detailing your home's value as well as a comparison with similar homes in the area
Home Values in the Area
Average Home Value in this Area
Purchase History
| Date | Buyer | Sale Price | Title Company |
|---|---|---|---|
| Servideo Paul E | $220,000 | -- | |
| Servideo Paul E | $220,000 | -- | |
| Orr Catherine M | -- | -- |
Source: Public Records
Mortgage History
| Date | Status | Borrower | Loan Amount |
|---|---|---|---|
| Open | Servideo Paul E | $176,000 | |
| Closed | Servideo Paul E | $176,000 |
Source: Public Records
Tax History
| Year | Tax Paid | Tax Assessment Tax Assessment Total Assessment is a certain percentage of the fair market value that is determined by local assessors to be the total taxable value of land and additions on the property. | Land | Improvement |
|---|---|---|---|---|
| 2025 | $4,610 | $231,900 | $53,000 | $178,900 |
| 2024 | $4,418 | $231,900 | $53,000 | $178,900 |
| 2023 | $4,418 | $231,900 | $53,000 | $178,900 |
| 2022 | $4,346 | $169,700 | $49,200 | $120,500 |
| 2021 | $0 | $169,400 | $49,200 | $120,200 |
| 2020 | $0 | $169,400 | $49,200 | $120,200 |
| 2019 | $4,254 | $169,400 | $49,200 | $120,200 |
| 2018 | $3,950 | $162,800 | $49,200 | $113,600 |
| 2017 | $3,267 | $132,700 | $43,800 | $88,900 |
| 2016 | $3,178 | $132,700 | $43,800 | $88,900 |
| 2015 | $2,983 | $132,700 | $43,800 | $88,900 |
| 2014 | $2,918 | $132,700 | $43,800 | $88,900 |
Source: Public Records
Map
Nearby Homes
Your Personal Tour Guide
Ask me questions while you tour the home.