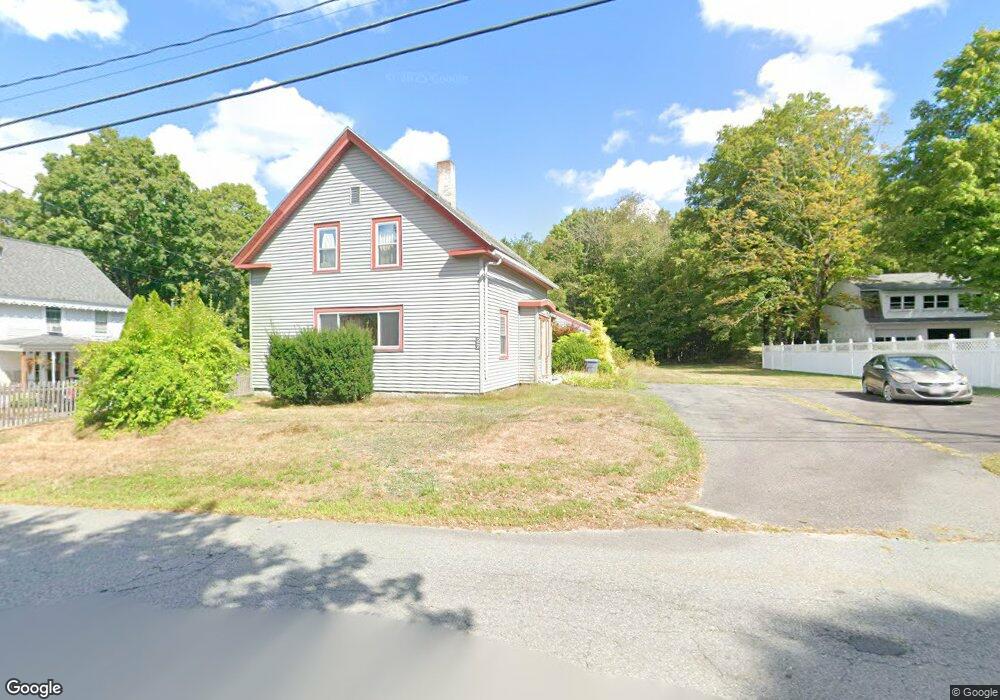
22 W Elm St West Townsend, MA 01474
Estimated Value: $288,000 - $489,000
5
Beds
2
Baths
2,391
Sq Ft
$164/Sq Ft
Est. Value
About This Home
This home is located at 22 W Elm St, West Townsend, MA 01474 and is currently estimated at $391,721, approximately $163 per square foot. 22 W Elm St is a home located in Middlesex County with nearby schools including North Middlesex Regional High School.
Ownership History
Date
Name
Owned For
Owner Type
Purchase Details
Closed on
Mar 9, 2004
Sold by
Laplante Elaine M and Moore Elaine
Bought by
Merrill Jamie and Moore Matthew
Current Estimated Value
Home Financials for this Owner
Home Financials are based on the most recent Mortgage that was taken out on this home.
Original Mortgage
$73,244
Outstanding Balance
$34,111
Interest Rate
5.62%
Mortgage Type
Purchase Money Mortgage
Estimated Equity
$357,610
Create a Home Valuation Report for This Property
The Home Valuation Report is an in-depth analysis detailing your home's value as well as a comparison with similar homes in the area
Home Values in the Area
Average Home Value in this Area
Purchase History
| Date | Buyer | Sale Price | Title Company |
|---|---|---|---|
| Merrill Jamie | $208,000 | -- | |
| Merrill Jamie | $208,000 | -- |
Source: Public Records
Mortgage History
| Date | Status | Borrower | Loan Amount |
|---|---|---|---|
| Open | Merrill Jamie | $73,244 | |
| Closed | Merrill Jamie | $73,244 | |
| Previous Owner | Merrill Jamie | $50,000 |
Source: Public Records
Tax History Compared to Growth
Tax History
| Year | Tax Paid | Tax Assessment Tax Assessment Total Assessment is a certain percentage of the fair market value that is determined by local assessors to be the total taxable value of land and additions on the property. | Land | Improvement |
|---|---|---|---|---|
| 2025 | $4,976 | $342,700 | $101,900 | $240,800 |
| 2024 | $4,845 | $336,200 | $101,900 | $234,300 |
| 2023 | $3,031 | $296,100 | $93,200 | $202,900 |
| 2022 | $4,401 | $249,900 | $79,200 | $170,700 |
| 2021 | $5,955 | $229,900 | $79,000 | $150,900 |
| 2020 | $3,970 | $203,400 | $68,600 | $134,800 |
| 2019 | $2,813 | $203,400 | $68,600 | $134,800 |
| 2018 | $2,510 | $190,800 | $70,000 | $120,800 |
| 2017 | $3,792 | $192,800 | $73,700 | $119,100 |
| 2016 | $3,819 | $192,900 | $73,700 | $119,200 |
| 2015 | $3,746 | $196,000 | $76,800 | $119,200 |
| 2014 | $3,703 | $189,200 | $70,000 | $119,200 |
Source: Public Records
Map
Nearby Homes
- 11 Fox Run
- 86 W Elm Lunenburg Rd Blood Rd
- 18 Bridle Path
- 114 Blood Rd
- 91 Lunenburg Rd
- 53 W Meadow Rd
- 20 Bayberry Hill Rd
- 1 Depot Street Extension Unit 2
- 1 Depot Street Extension Unit 5
- 1 Depot Street Extension Unit 3
- 1 Depot Street Extension Unit 4
- 30 Bailey Rd
- 10 Stearns Ave
- 1235 Townsend Rd
- 75 Highland St
- 2 Tamarack Ln
- 0 Brookline St
- 91 Highland St
- 0 Tyler Rd Unit 72560808
- 1275 Valley Rd