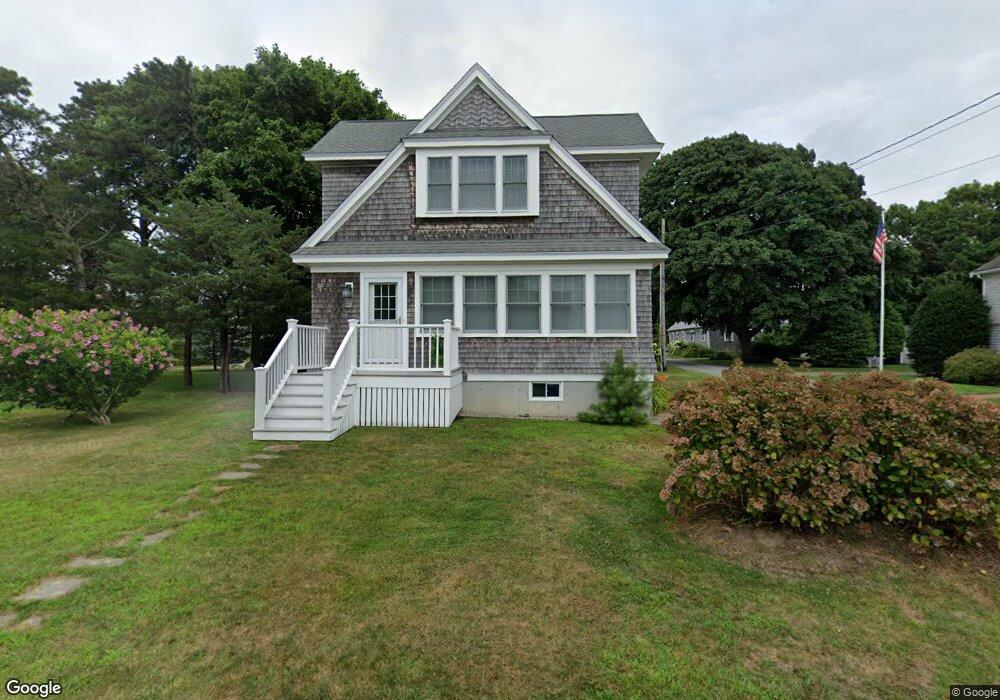
22 Wamsutta Ave Pocasset, MA 02559
Pocasset NeighborhoodEstimated Value: $1,256,000 - $1,445,779
2
Beds
3
Baths
2,658
Sq Ft
$513/Sq Ft
Est. Value
About This Home
This home is located at 22 Wamsutta Ave, Pocasset, MA 02559 and is currently estimated at $1,363,445, approximately $512 per square foot. 22 Wamsutta Ave is a home located in Barnstable County with nearby schools including Bourne High School, Cadence Academy Preschool - Bourne, and Heritage Christian Academy.
Ownership History
Date
Name
Owned For
Owner Type
Purchase Details
Closed on
Jul 11, 2019
Sold by
Keymont Kevin P and Keymont Judith A
Bought by
Patel Reena and Patel Punit
Current Estimated Value
Home Financials for this Owner
Home Financials are based on the most recent Mortgage that was taken out on this home.
Original Mortgage
$720,000
Outstanding Balance
$629,129
Interest Rate
3.9%
Mortgage Type
Purchase Money Mortgage
Estimated Equity
$734,316
Purchase Details
Closed on
Dec 4, 1989
Sold by
Kemp Malcolm S
Bought by
Keymont Kevin P
Home Financials for this Owner
Home Financials are based on the most recent Mortgage that was taken out on this home.
Original Mortgage
$105,000
Interest Rate
9.82%
Mortgage Type
Purchase Money Mortgage
Create a Home Valuation Report for This Property
The Home Valuation Report is an in-depth analysis detailing your home's value as well as a comparison with similar homes in the area
Home Values in the Area
Average Home Value in this Area
Purchase History
| Date | Buyer | Sale Price | Title Company |
|---|---|---|---|
| Patel Reena | $900,000 | -- | |
| Keymont Kevin P | $140,000 | -- | |
| Keymont Kevin P | $140,000 | -- |
Source: Public Records
Mortgage History
| Date | Status | Borrower | Loan Amount |
|---|---|---|---|
| Open | Patel Reena | $720,000 | |
| Previous Owner | Keymont Kevin P | $80,000 | |
| Previous Owner | Keymont Kevin P | $105,000 |
Source: Public Records
Tax History Compared to Growth
Tax History
| Year | Tax Paid | Tax Assessment Tax Assessment Total Assessment is a certain percentage of the fair market value that is determined by local assessors to be the total taxable value of land and additions on the property. | Land | Improvement |
|---|---|---|---|---|
| 2025 | $9,378 | $1,200,800 | $513,500 | $687,300 |
| 2024 | $9,232 | $1,151,100 | $489,000 | $662,100 |
| 2023 | $8,975 | $1,018,700 | $432,800 | $585,900 |
| 2022 | $8,829 | $875,000 | $383,000 | $492,000 |
| 2021 | $8,495 | $788,800 | $348,600 | $440,200 |
| 2020 | $6,573 | $612,000 | $224,400 | $387,600 |
| 2019 | $5,955 | $566,600 | $224,400 | $342,200 |
| 2018 | $5,708 | $541,600 | $219,200 | $322,400 |
| 2017 | $5,649 | $548,400 | $217,200 | $331,200 |
| 2016 | $5,371 | $528,600 | $206,300 | $322,300 |
| 2015 | $5,159 | $512,300 | $190,000 | $322,300 |
Source: Public Records
Map
Nearby Homes
- 171 Bellavista Dr
- 22 Nairn Rd
- 254 Barlows Landing Rd
- 48 Red Brook Harbor Rd
- 34 Kenwood Rd
- 3 Red Brook Pond Dr
- 45 Kenwood Rd
- 1094 County Rd
- 940 County Rd
- 940 County Rd
- 70 Wings Neck Rd
- 709 County Rd
- 174 Barlows Landing Rd
- 24 Richmond Rd
- 7 4th Ave
- 14 Navajo Rd
- 15 1st St
- 89 Harbor Dr
- 39 Bennets Neck Dr
- 1234 Route 28a