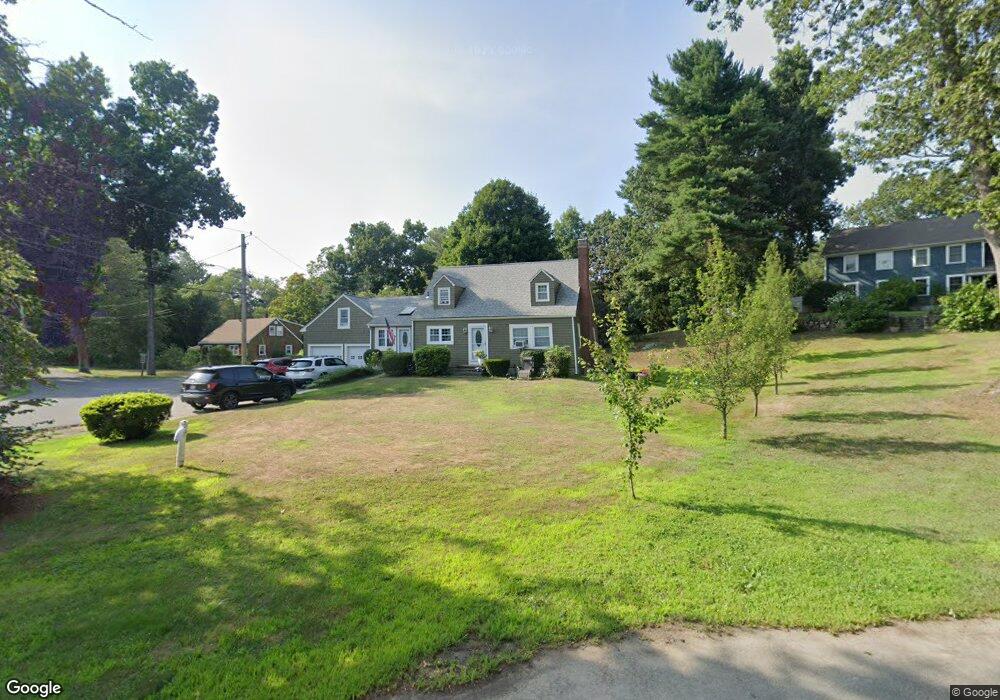
22 Webb St Unit 1 Middleton, MA 01949
Estimated Value: $765,000 - $926,000
3
Beds
2
Baths
1,838
Sq Ft
$454/Sq Ft
Est. Value
About This Home
This home is located at 22 Webb St Unit 1, Middleton, MA 01949 and is currently estimated at $833,974, approximately $453 per square foot. 22 Webb St Unit 1 is a home located in Essex County with nearby schools including Howe-Manning Elementary School, Fuller Meadow Elementary School, and Masconomet Regional Middle School.
Ownership History
Date
Name
Owned For
Owner Type
Purchase Details
Closed on
Nov 4, 2010
Sold by
Smith Robert A and Smith Amanda L
Bought by
Smith Robert A
Current Estimated Value
Purchase Details
Closed on
Jul 29, 1998
Sold by
Robert B Jordan Rt and Jordan
Bought by
Black Brian E and Black Stephanie M
Home Financials for this Owner
Home Financials are based on the most recent Mortgage that was taken out on this home.
Original Mortgage
$209,000
Interest Rate
6.92%
Mortgage Type
Purchase Money Mortgage
Create a Home Valuation Report for This Property
The Home Valuation Report is an in-depth analysis detailing your home's value as well as a comparison with similar homes in the area
Home Values in the Area
Average Home Value in this Area
Purchase History
| Date | Buyer | Sale Price | Title Company |
|---|---|---|---|
| Smith Robert A | -- | -- | |
| Smith Robert A | -- | -- | |
| Black Brian E | $220,000 | -- | |
| Black Brian E | $220,000 | -- |
Source: Public Records
Mortgage History
| Date | Status | Borrower | Loan Amount |
|---|---|---|---|
| Previous Owner | Black Brian E | $209,000 |
Source: Public Records
Tax History Compared to Growth
Tax History
| Year | Tax Paid | Tax Assessment Tax Assessment Total Assessment is a certain percentage of the fair market value that is determined by local assessors to be the total taxable value of land and additions on the property. | Land | Improvement |
|---|---|---|---|---|
| 2025 | $8,202 | $689,800 | $343,300 | $346,500 |
| 2024 | $8,091 | $686,300 | $319,000 | $367,300 |
| 2023 | $7,495 | $582,400 | $319,000 | $263,400 |
| 2022 | $6,404 | $483,300 | $253,800 | $229,500 |
| 2021 | $6,030 | $439,500 | $224,800 | $214,700 |
| 2020 | $6,006 | $441,000 | $224,800 | $216,200 |
| 2019 | $6,136 | $448,200 | $224,800 | $223,400 |
| 2018 | $5,722 | $409,900 | $202,200 | $207,700 |
| 2017 | $5,281 | $378,600 | $182,800 | $195,800 |
| 2016 | $5,309 | $382,200 | $200,200 | $182,000 |
| 2015 | $4,696 | $340,800 | $169,700 | $171,100 |
Source: Public Records
Map
Nearby Homes
- 47 Maple St Unit A
- 49 Maple St Unit B
- 39 Central St
- 10 Callaway Dr Unit 10
- 10 Oak St
- 1 Mill Terrace
- 3 Useadoor St
- 1 Overbrook Rd
- 77 Essex St
- 1 Mills Point Unit 1
- 67 Fuller Pond Rd
- 6 Masi Meadow Ln Unit B
- 8 Masi Meadow Ln Unit A
- 78 Mill St
- 89 Forest St
- 2 Tyler Ln
- 22 Locust St
- 196-200 B1 N Main St
- 112 Mill St
- 6 White Ln