Estimated Value: $160,000 - $207,000
2
Beds
1
Bath
616
Sq Ft
$294/Sq Ft
Est. Value
About This Home
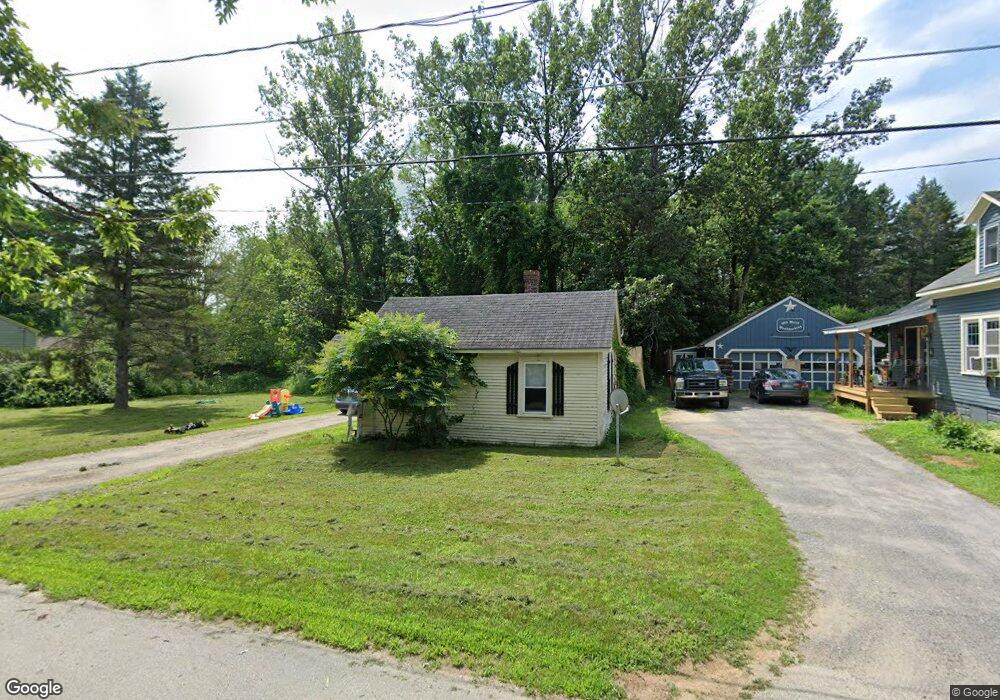
This home is located at 22 Wetmore St, Keene, NH 03431 and is currently estimated at $181,339, approximately $294 per square foot. 22 Wetmore St is a home with nearby schools including Mount Gilead Elementary School, Symonds Elementary School, and Keene Middle School.
Ownership History
Date
Name
Owned For
Owner Type
Purchase Details
Closed on
Aug 26, 2024
Sold by
Lower Fred D
Bought by
Carey Sonja
Current Estimated Value
Home Financials for this Owner
Home Financials are based on the most recent Mortgage that was taken out on this home.
Original Mortgage
$146,000
Outstanding Balance
$144,485
Interest Rate
6.89%
Mortgage Type
Purchase Money Mortgage
Estimated Equity
$36,854
Purchase Details
Closed on
Sep 29, 2005
Sold by
Chickering Virginia P
Bought by
Lower Fred D
Create a Home Valuation Report for This Property
The Home Valuation Report is an in-depth analysis detailing your home's value as well as a comparison with similar homes in the area
Home Values in the Area
Average Home Value in this Area
Purchase History
| Date | Buyer | Sale Price | Title Company |
|---|---|---|---|
| Carey Sonja | $146,000 | None Available | |
| Carey Sonja | $146,000 | None Available | |
| Lower Fred D | $77,300 | -- | |
| Lower Fred D | $77,300 | -- |
Source: Public Records
Mortgage History
| Date | Status | Borrower | Loan Amount |
|---|---|---|---|
| Open | Carey Sonja | $146,000 | |
| Closed | Carey Sonja | $146,000 |
Source: Public Records
Tax History Compared to Growth
Tax History
| Year | Tax Paid | Tax Assessment Tax Assessment Total Assessment is a certain percentage of the fair market value that is determined by local assessors to be the total taxable value of land and additions on the property. | Land | Improvement |
|---|---|---|---|---|
| 2024 | $3,489 | $105,500 | $32,000 | $73,500 |
| 2023 | $3,179 | $99,700 | $32,000 | $67,700 |
| 2022 | $3,094 | $99,700 | $32,000 | $67,700 |
| 2021 | $3,119 | $99,700 | $32,000 | $67,700 |
| 2020 | $2,874 | $77,100 | $42,500 | $34,600 |
| 2019 | $1,200 | $77,100 | $42,500 | $34,600 |
| 2018 | $1,097 | $77,100 | $42,500 | $34,600 |
| 2017 | $2,847 | $76,500 | $41,900 | $34,600 |
| 2016 | $1,029 | $76,500 | $41,900 | $34,600 |
Source: Public Records
Map
Nearby Homes