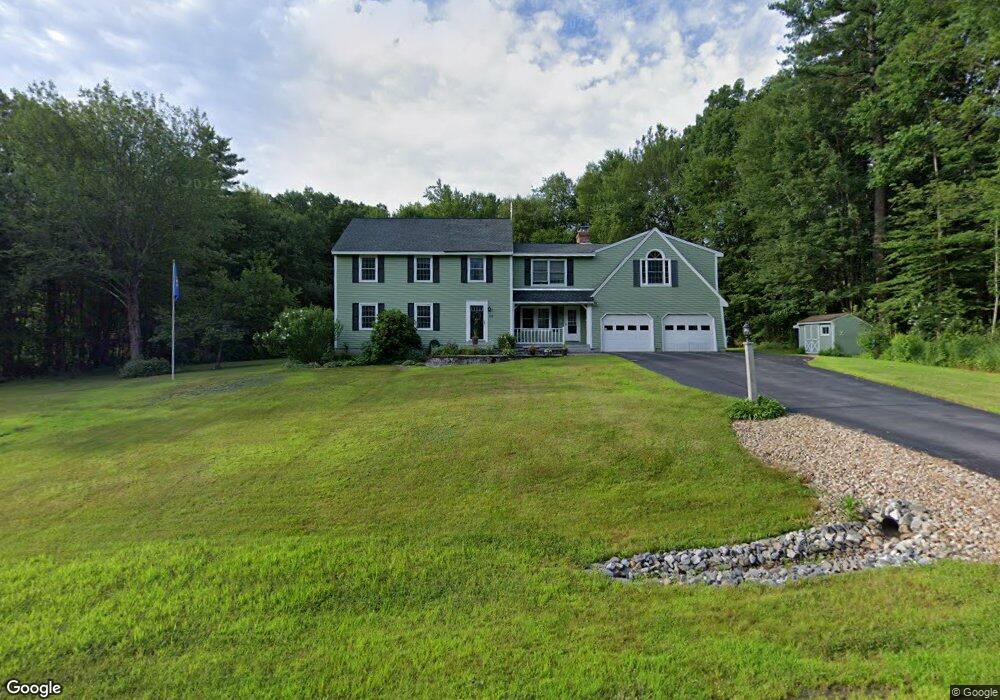
22 Windsor Dr Merrimack, NH 03054
Estimated Value: $728,000 - $828,093
4
Beds
3
Baths
4,167
Sq Ft
$185/Sq Ft
Est. Value
About This Home
This home is located at 22 Windsor Dr, Merrimack, NH 03054 and is currently estimated at $771,773, approximately $185 per square foot. 22 Windsor Dr is a home located in Hillsborough County with nearby schools including James Mastricola Elementary School, Merrimack Middle School, and James Mastricola Upper Elementary School.
Ownership History
Date
Name
Owned For
Owner Type
Purchase Details
Closed on
Dec 18, 2013
Sold by
Maston 3Rd Roy E and Maston Cynthia L
Bought by
Maston Ft and Maston Roy E
Current Estimated Value
Purchase Details
Closed on
May 11, 2007
Sold by
Nihan Thomas J and Nihan Maria I
Bought by
True Mark D
Home Financials for this Owner
Home Financials are based on the most recent Mortgage that was taken out on this home.
Original Mortgage
$256,500
Interest Rate
6.21%
Mortgage Type
Purchase Money Mortgage
Purchase Details
Closed on
Jun 7, 1999
Sold by
Wilson Ii John A and Wilson Rhonda L
Bought by
Maston Roy Emerson and Maston Cynthia Lynns
Home Financials for this Owner
Home Financials are based on the most recent Mortgage that was taken out on this home.
Original Mortgage
$195,300
Interest Rate
6.85%
Create a Home Valuation Report for This Property
The Home Valuation Report is an in-depth analysis detailing your home's value as well as a comparison with similar homes in the area
Home Values in the Area
Average Home Value in this Area
Purchase History
| Date | Buyer | Sale Price | Title Company |
|---|---|---|---|
| Maston Ft | -- | -- | |
| True Mark D | $285,000 | -- | |
| Maston Roy Emerson | $217,000 | -- |
Source: Public Records
Mortgage History
| Date | Status | Borrower | Loan Amount |
|---|---|---|---|
| Previous Owner | Maston Roy Emerson | $194,750 | |
| Previous Owner | Maston Roy Emerson | $256,500 | |
| Previous Owner | Maston Roy Emerson | $195,300 |
Source: Public Records
Tax History Compared to Growth
Tax History
| Year | Tax Paid | Tax Assessment Tax Assessment Total Assessment is a certain percentage of the fair market value that is determined by local assessors to be the total taxable value of land and additions on the property. | Land | Improvement |
|---|---|---|---|---|
| 2024 | $11,584 | $559,900 | $240,000 | $319,900 |
| 2023 | $10,890 | $559,900 | $240,000 | $319,900 |
| 2022 | $9,731 | $559,900 | $240,000 | $319,900 |
| 2021 | $9,613 | $559,900 | $240,000 | $319,900 |
| 2020 | $10,035 | $417,100 | $168,000 | $249,100 |
| 2019 | $9,840 | $407,800 | $168,000 | $239,800 |
| 2018 | $9,652 | $407,800 | $168,000 | $239,800 |
| 2017 | $9,530 | $407,800 | $168,000 | $239,800 |
| 2016 | $9,294 | $407,800 | $168,000 | $239,800 |
| 2015 | $9,438 | $381,800 | $156,000 | $225,800 |
| 2014 | $9,198 | $381,800 | $156,000 | $225,800 |
| 2013 | $9,129 | $381,800 | $156,000 | $225,800 |
Source: Public Records
Map
Nearby Homes
- 5 Carter Rd
- 4 Miriam Rd
- 2 Baxter Ln
- 10 Colman Path
- 79 Woodward Rd
- 4 Milford St
- 14 Silver Doe Ln
- 29 Brieann Dr
- 40 Captain Bannon Cir
- 20 Jakes Ln
- 44 McQuade Brook Rd
- 10 Winterberry Dr
- 14 Mayflower Dr
- 40 Turkey Hill Rd
- 7 Beacon Dr
- 5 Fernwood Dr
- 37 Baboosic Lake Rd
- 8 Donovan Ct
- 16 Summit Rd
- 98 Indian Rock Rd
- 24 Windsor Dr
- 20 Windsor Dr
- 259 Baboosic Lake Rd
- 261 Baboosic Lake Rd
- 23 Windsor Dr
- 21 Windsor Dr
- 257 Baboosic Lake Rd
- 25 Windsor Dr
- 263 Baboosic Lake Rd
- 18 Windsor Dr
- 255 Baboosic Lake Rd
- 19 Windsor Dr
- 264 Baboosic Lake Rd
- 253 Baboosic Lake Rd
- 260 Baboosic Lake Rd
- 265 Baboosic Lake Rd
- 16 Windsor Dr
- 256 Baboosic Lake Rd
- 17 Windsor Dr
- 251 Baboosic Lake Rd