Estimated Value: $1,869,008 - $2,280,000
3
Beds
3
Baths
2,100
Sq Ft
$988/Sq Ft
Est. Value
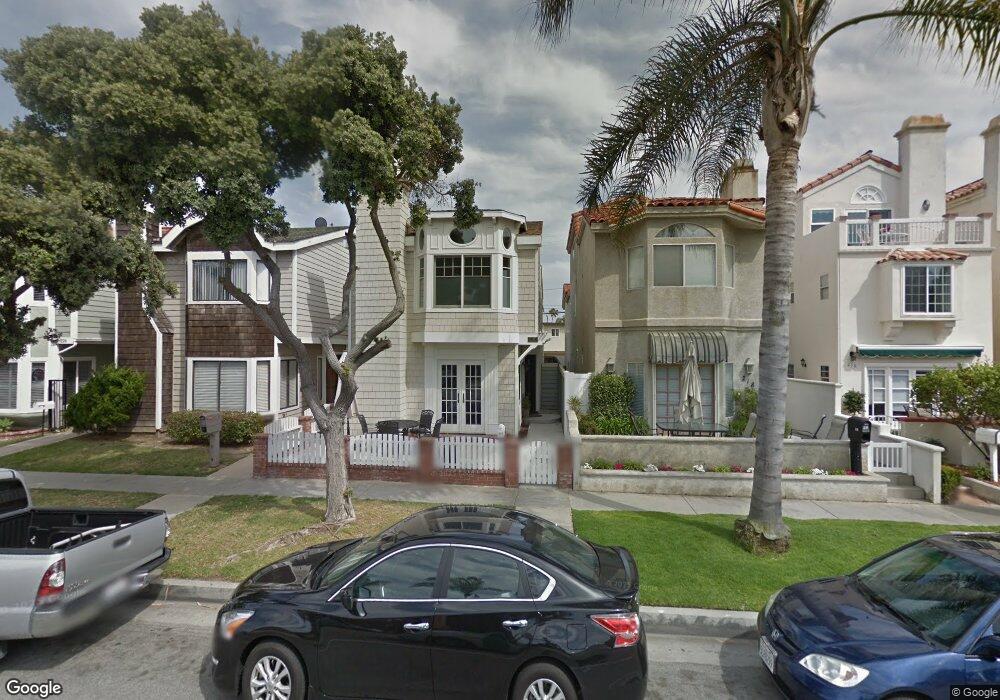
About This Home
This home is located at 220 17th St, Huntington Beach, CA 92648 and is currently estimated at $2,075,502, approximately $988 per square foot. 220 17th St is a home located in Orange County with nearby schools including Agnes L. Smith Elementary, Ethel Dwyer Middle, and Huntington Beach High School.
Ownership History
Date
Name
Owned For
Owner Type
Purchase Details
Closed on
Jul 25, 2018
Sold by
Park Ernie Zachary
Bought by
Eliades George
Current Estimated Value
Home Financials for this Owner
Home Financials are based on the most recent Mortgage that was taken out on this home.
Original Mortgage
$125,000
Interest Rate
4.5%
Mortgage Type
New Conventional
Purchase Details
Closed on
Nov 19, 2015
Sold by
Park Ernie Zachary
Bought by
Park Ernie Zachary
Home Financials for this Owner
Home Financials are based on the most recent Mortgage that was taken out on this home.
Original Mortgage
$289,000
Interest Rate
3.76%
Mortgage Type
New Conventional
Purchase Details
Closed on
Jun 1, 2007
Sold by
Park Kathleen E
Bought by
Park Ernie Zachary
Purchase Details
Closed on
Aug 24, 1999
Sold by
Moore Douglas M and Moore Jean A
Bought by
Park Ernie Zachary and Park Kathleen E
Create a Home Valuation Report for This Property
The Home Valuation Report is an in-depth analysis detailing your home's value as well as a comparison with similar homes in the area
Home Values in the Area
Average Home Value in this Area
Purchase History
| Date | Buyer | Sale Price | Title Company |
|---|---|---|---|
| Eliades George | $1,250,000 | None Available | |
| Park Ernie Zachary | -- | Western Resources Title | |
| Park Ernie Zachary | -- | None Available | |
| Park Ernie Zachary | $412,000 | Fidelity National Title |
Source: Public Records
Mortgage History
| Date | Status | Borrower | Loan Amount |
|---|---|---|---|
| Previous Owner | Eliades George | $125,000 | |
| Previous Owner | Park Ernie Zachary | $289,000 |
Source: Public Records
Tax History Compared to Growth
Tax History
| Year | Tax Paid | Tax Assessment Tax Assessment Total Assessment is a certain percentage of the fair market value that is determined by local assessors to be the total taxable value of land and additions on the property. | Land | Improvement |
|---|---|---|---|---|
| 2025 | $15,387 | $1,394,398 | $1,100,274 | $294,124 |
| 2024 | $15,387 | $1,367,057 | $1,078,700 | $288,357 |
| 2023 | $15,046 | $1,340,252 | $1,057,549 | $282,703 |
| 2022 | $14,652 | $1,313,973 | $1,036,813 | $277,160 |
| 2021 | $14,378 | $1,288,209 | $1,016,483 | $271,726 |
| 2020 | $14,286 | $1,275,000 | $1,006,060 | $268,940 |
| 2019 | $14,111 | $1,250,000 | $986,333 | $263,667 |
| 2018 | $7,553 | $647,922 | $360,931 | $286,991 |
| 2017 | $7,453 | $635,218 | $353,854 | $281,364 |
| 2016 | $7,122 | $622,763 | $346,915 | $275,848 |
| 2015 | $7,055 | $613,409 | $341,704 | $271,705 |
| 2014 | $6,908 | $601,394 | $335,011 | $266,383 |
Source: Public Records
Map
Nearby Homes
- 304 18th St
- 306 17th St
- 125 16th St
- 1516 Pacific Coast Hwy Unit 101
- 1400 Pacific Coast Hwy Unit 305
- 419 18th St
- 412 20th St
- 319 14th St Unit B
- 2000 Pacific Coast Hwy Unit 313
- 2000 Pacific Coast Hwy Unit 103
- 2000 Pacific Coast Hwy Unit 309
- 505 17th St
- 416 15th St
- 413 14th St Unit D
- 521 18th St
- 1200 Pacific Coast Hwy Unit 102
- 1200 Pacific Coast Hwy
- 1200 Pacific Coast Hwy Unit 214
- 304 Goldenwest St
- 228 12th St Unit 1113 Olive Av