Estimated Value: $2,239,908 - $3,046,000
3
Beds
5
Baths
2,800
Sq Ft
$957/Sq Ft
Est. Value
About This Home
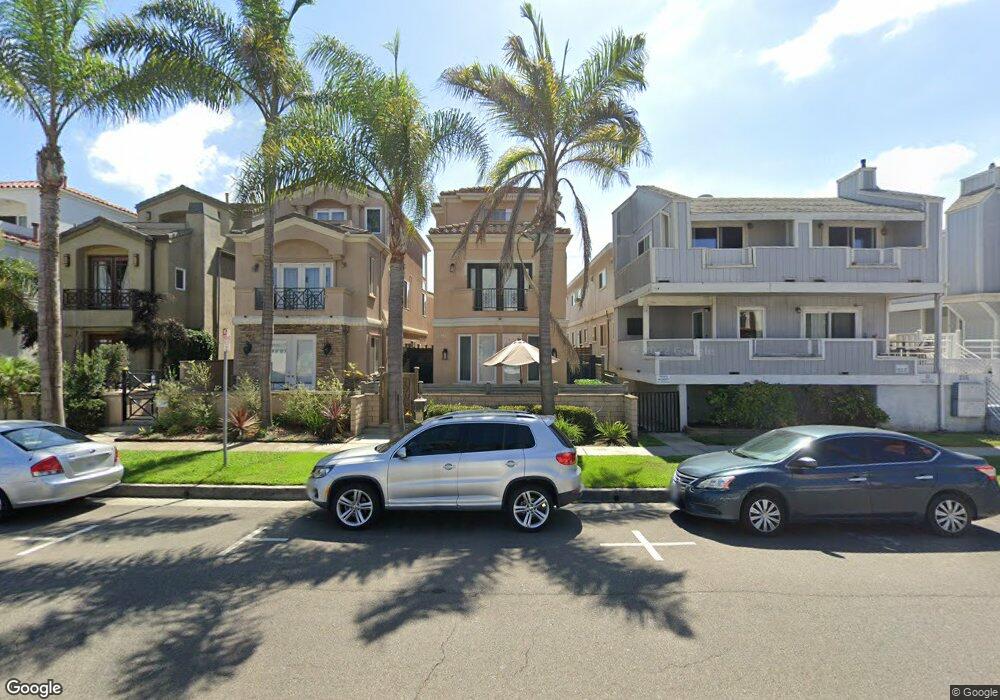
This home is located at 220 6th St, Huntington Beach, CA 92648 and is currently estimated at $2,679,477, approximately $956 per square foot. 220 6th St is a home located in Orange County with nearby schools including Agnes L. Smith Elementary, Ethel Dwyer Middle, and Huntington Beach High School.
Ownership History
Date
Name
Owned For
Owner Type
Purchase Details
Closed on
Jan 26, 2005
Sold by
Noel Leonora G
Bought by
Noel Leonora G and Leonora G Noel Trust
Current Estimated Value
Purchase Details
Closed on
Jul 3, 2002
Sold by
Moreau Dennis J and Moreau Patricia A
Bought by
Noel Leonora G
Home Financials for this Owner
Home Financials are based on the most recent Mortgage that was taken out on this home.
Original Mortgage
$574,900
Outstanding Balance
$223,046
Interest Rate
5.52%
Estimated Equity
$2,456,431
Purchase Details
Closed on
Oct 20, 2000
Sold by
Moreau Dennis J and Moreau Patricia A
Bought by
Moreau Dennis J and Moreau Patricia A
Home Financials for this Owner
Home Financials are based on the most recent Mortgage that was taken out on this home.
Original Mortgage
$239,400
Interest Rate
7.67%
Create a Home Valuation Report for This Property
The Home Valuation Report is an in-depth analysis detailing your home's value as well as a comparison with similar homes in the area
Home Values in the Area
Average Home Value in this Area
Purchase History
| Date | Buyer | Sale Price | Title Company |
|---|---|---|---|
| Noel Leonora G | -- | -- | |
| Noel Leonora G | $775,000 | Orange Coast Title Company | |
| Moreau Dennis J | -- | Fidelity National Title Ins | |
| Moreau Dennis J | $465,000 | -- |
Source: Public Records
Mortgage History
| Date | Status | Borrower | Loan Amount |
|---|---|---|---|
| Open | Noel Leonora G | $574,900 | |
| Previous Owner | Moreau Dennis J | $239,400 |
Source: Public Records
Tax History Compared to Growth
Tax History
| Year | Tax Paid | Tax Assessment Tax Assessment Total Assessment is a certain percentage of the fair market value that is determined by local assessors to be the total taxable value of land and additions on the property. | Land | Improvement |
|---|---|---|---|---|
| 2025 | $12,525 | $1,122,452 | $797,643 | $324,809 |
| 2024 | $12,525 | $1,100,444 | $782,003 | $318,441 |
| 2023 | $12,247 | $1,078,867 | $766,669 | $312,198 |
| 2022 | $11,928 | $1,057,713 | $751,636 | $306,077 |
| 2021 | $11,706 | $1,036,974 | $736,898 | $300,076 |
| 2020 | $11,631 | $1,026,342 | $729,342 | $297,000 |
| 2019 | $11,491 | $1,006,218 | $715,041 | $291,177 |
| 2018 | $11,314 | $986,489 | $701,021 | $285,468 |
| 2017 | $11,164 | $967,147 | $687,276 | $279,871 |
| 2016 | $10,664 | $948,184 | $673,800 | $274,384 |
| 2015 | $10,563 | $933,942 | $663,679 | $270,263 |
| 2014 | $10,343 | $915,648 | $650,679 | $264,969 |
Source: Public Records
Map
Nearby Homes
- 517 Walnut Ave
- 316 6th St
- 308 5th St
- 715 Olive Ave
- 309 8th St
- 216 Walnut Ave
- 214 Walnut Ave
- 414 Main St Unit 330
- 414 Main St Unit 420
- 414 Main St Unit 400
- 414 Main St Unit 310
- 414 Main St Unit 430
- 414 Main St Unit 200
- 711 Pacific Coast Hwy Unit 330
- 711 Pacific Coast Hwy Unit 206
- 711 Pacific Coast Hwy Unit 303
- 711 Pacific Coast Hwy Unit 109
- 200 Pacific Coast Hwy Unit 130
- 219 1st St
- 430 Lake St Unit 204