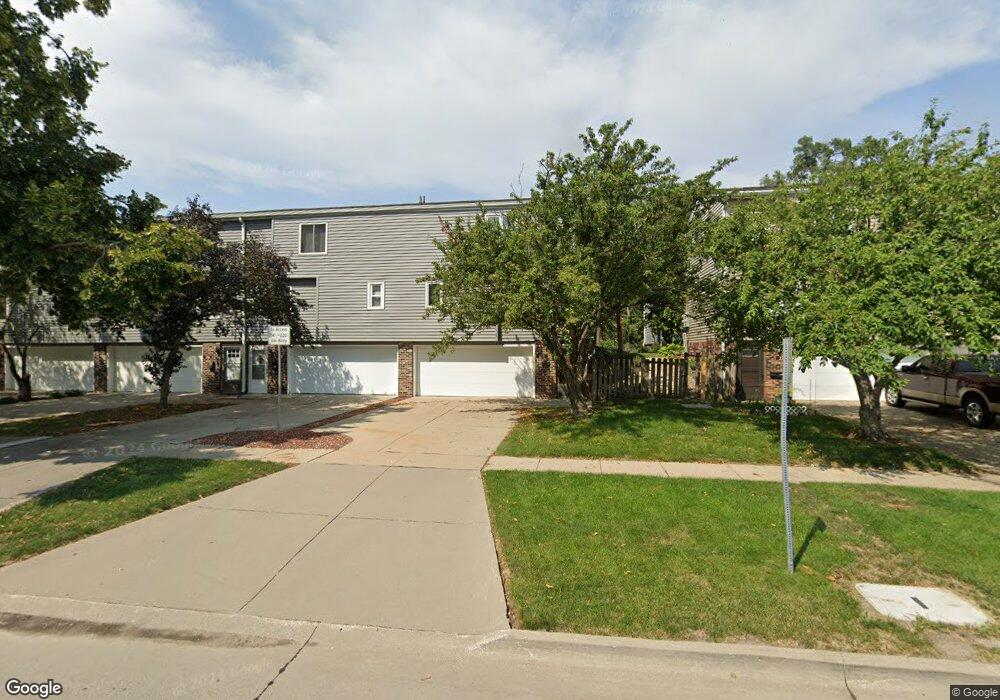
220 6th St Unit 1 West Des Moines, IA 50265
Estimated Value: $161,000 - $194,000
3
Beds
2
Baths
1,175
Sq Ft
$151/Sq Ft
Est. Value
About This Home
This home is located at 220 6th St Unit 1, West Des Moines, IA 50265 and is currently estimated at $177,146, approximately $150 per square foot. 220 6th St Unit 1 is a home located in Polk County with nearby schools including Hillside Elementary School, Stilwell Junior High School, and Valley Southwoods Freshman High School.
Ownership History
Date
Name
Owned For
Owner Type
Purchase Details
Closed on
Oct 1, 2000
Sold by
Pliner Kathy
Bought by
Ryan Vivian
Current Estimated Value
Home Financials for this Owner
Home Financials are based on the most recent Mortgage that was taken out on this home.
Original Mortgage
$58,700
Outstanding Balance
$21,288
Interest Rate
8.03%
Estimated Equity
$155,858
Purchase Details
Closed on
Jan 16, 1998
Sold by
Mainland Realty Inc
Bought by
Vacco Rory A and Vacco Betsy A
Home Financials for this Owner
Home Financials are based on the most recent Mortgage that was taken out on this home.
Original Mortgage
$61,968
Interest Rate
7.24%
Mortgage Type
FHA
Purchase Details
Closed on
Jan 15, 1998
Sold by
Vacco Rory A and Vacco Betsy A
Bought by
Pliner Kathy
Home Financials for this Owner
Home Financials are based on the most recent Mortgage that was taken out on this home.
Original Mortgage
$61,968
Interest Rate
7.24%
Mortgage Type
FHA
Create a Home Valuation Report for This Property
The Home Valuation Report is an in-depth analysis detailing your home's value as well as a comparison with similar homes in the area
Home Values in the Area
Average Home Value in this Area
Purchase History
| Date | Buyer | Sale Price | Title Company |
|---|---|---|---|
| Ryan Vivian | $73,000 | -- | |
| Vacco Rory A | $48,000 | -- | |
| Mainland Realty Inc | $44,500 | -- | |
| Pliner Kathy | $61,500 | -- |
Source: Public Records
Mortgage History
| Date | Status | Borrower | Loan Amount |
|---|---|---|---|
| Open | Ryan Vivian | $58,700 | |
| Previous Owner | Pliner Kathy | $61,968 |
Source: Public Records
Tax History Compared to Growth
Tax History
| Year | Tax Paid | Tax Assessment Tax Assessment Total Assessment is a certain percentage of the fair market value that is determined by local assessors to be the total taxable value of land and additions on the property. | Land | Improvement |
|---|---|---|---|---|
| 2025 | $1,848 | $144,700 | $22,100 | $122,600 |
| 2024 | $1,848 | $127,100 | $19,100 | $108,000 |
| 2023 | $1,806 | $127,100 | $19,100 | $108,000 |
| 2022 | $1,782 | $102,400 | $15,600 | $86,800 |
| 2021 | $1,664 | $102,400 | $15,600 | $86,800 |
| 2020 | $1,636 | $91,600 | $14,800 | $76,800 |
| 2019 | $1,546 | $91,600 | $14,800 | $76,800 |
| 2018 | $1,546 | $84,000 | $14,400 | $69,600 |
| 2017 | $1,492 | $84,000 | $14,400 | $69,600 |
| 2016 | $1,456 | $79,100 | $14,400 | $64,700 |
| 2015 | $1,456 | $79,100 | $14,400 | $64,700 |
| 2014 | $1,828 | $96,100 | $15,900 | $80,200 |
Source: Public Records
Map
Nearby Homes