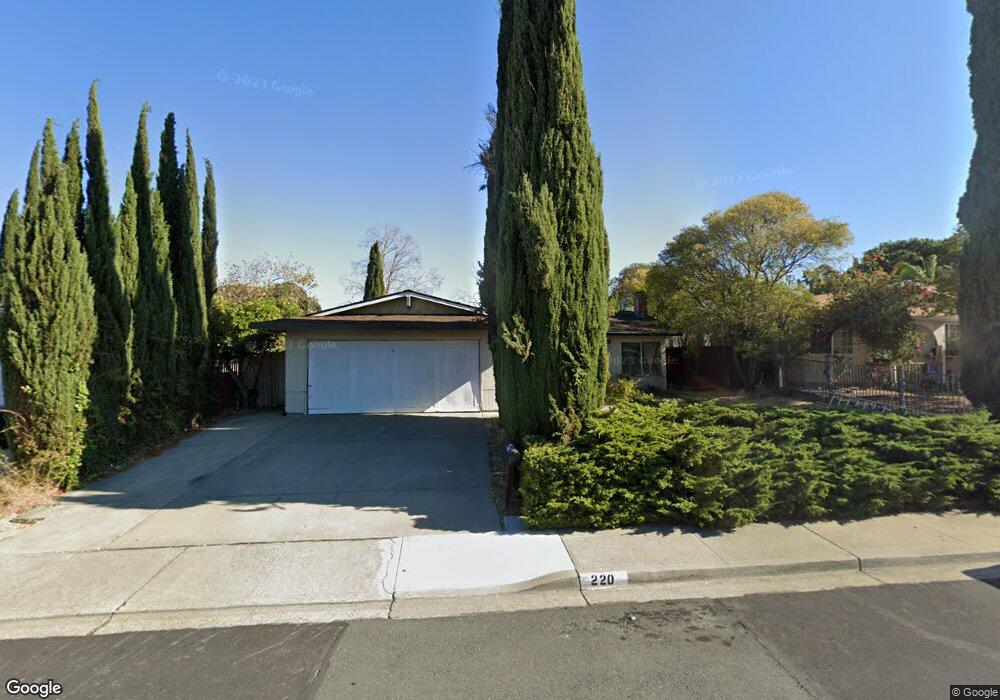
220 Agua Way Bay Point, CA 94565
Shore Acres NeighborhoodEstimated Value: $368,000 - $581,000
3
Beds
2
Baths
1,310
Sq Ft
$360/Sq Ft
Est. Value
About This Home
This home is located at 220 Agua Way, Bay Point, CA 94565 and is currently estimated at $471,990, approximately $360 per square foot. 220 Agua Way is a home located in Contra Costa County with nearby schools including Rio Vista Elementary School, Riverview Middle School, and Mt. Diablo High School.
Ownership History
Date
Name
Owned For
Owner Type
Purchase Details
Closed on
Feb 25, 2020
Sold by
Jiminez Jerry
Bought by
Jiminez Jerry
Current Estimated Value
Purchase Details
Closed on
Feb 1, 2020
Sold by
Jiminez Jerry J
Bought by
Jiminez Jerry James and Jiminez Jerry
Purchase Details
Closed on
Oct 23, 2018
Sold by
Jiminez Jerry J
Bought by
Jiminez Jerry J
Home Financials for this Owner
Home Financials are based on the most recent Mortgage that was taken out on this home.
Original Mortgage
$240,000
Interest Rate
4.6%
Mortgage Type
Commercial
Purchase Details
Closed on
May 10, 2001
Sold by
Vanvannguyen Thong Van and Dang Fai Thi
Bought by
Jiminez Jerry J
Home Financials for this Owner
Home Financials are based on the most recent Mortgage that was taken out on this home.
Original Mortgage
$120,000
Interest Rate
7.03%
Mortgage Type
Purchase Money Mortgage
Create a Home Valuation Report for This Property
The Home Valuation Report is an in-depth analysis detailing your home's value as well as a comparison with similar homes in the area
Home Values in the Area
Average Home Value in this Area
Purchase History
| Date | Buyer | Sale Price | Title Company |
|---|---|---|---|
| Jiminez Jerry | -- | None Available | |
| Jiminez Jerry James | -- | None Available | |
| Jiminez Jerry J | -- | Stewart Title Of California | |
| Jiminez Jerry J | $150,000 | Old Republic Title Company |
Source: Public Records
Mortgage History
| Date | Status | Borrower | Loan Amount |
|---|---|---|---|
| Closed | Jiminez Jerry J | $240,000 | |
| Closed | Jiminez Jerry J | $120,000 |
Source: Public Records
Tax History
| Year | Tax Paid | Tax Assessment Tax Assessment Total Assessment is a certain percentage of the fair market value that is determined by local assessors to be the total taxable value of land and additions on the property. | Land | Improvement |
|---|---|---|---|---|
| 2025 | $3,386 | $226,001 | $120,536 | $105,465 |
| 2024 | $3,204 | $221,571 | $118,173 | $103,398 |
| 2023 | $3,204 | $217,227 | $115,856 | $101,371 |
| 2022 | $3,183 | $212,969 | $113,585 | $99,384 |
| 2021 | $3,107 | $208,794 | $111,358 | $97,436 |
| 2019 | $3,021 | $202,603 | $108,056 | $94,547 |
| 2018 | $2,921 | $198,632 | $105,938 | $92,694 |
| 2017 | $2,830 | $194,738 | $103,861 | $90,877 |
| 2016 | $2,745 | $190,921 | $101,825 | $89,096 |
| 2015 | $2,713 | $188,054 | $100,296 | $87,758 |
| 2014 | $2,666 | $184,371 | $98,332 | $86,039 |
Source: Public Records
Map
Nearby Homes
- 166 San Joaquin Ct
- 215 San Bernardino Ct
- 130 Savona Way
- 55 Pacifica Ave Unit 49
- 55 Pacifica Ave Unit 77
- 55 Pacifica Ave Unit 90
- 55 Pacifica Ave Unit 146
- 621 Bounty Dr
- 97 Harbor Dr
- 93 Beach Dr
- 92 Beach Dr
- 87 Bay Dr
- 94 Anchor Dr
- 3777 Willow Pass Rd Unit 85
- 3777 Willow Pass Rd Unit 20
- 323 Rosemarie Place
- 43 Bay Dr
- 39 Canal Dr
- 39 Harbor Dr
- 149 Shore Rd
Your Personal Tour Guide
Ask me questions while you tour the home.