

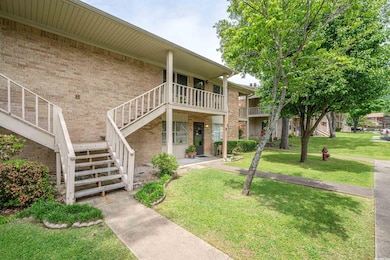
220 Cooper St Hot Springs National Park, AR 71913
2
Beds
2
Baths
1,268
Sq Ft
$130/mo
HOA Fee
Highlights
- Clubhouse
- Main Floor Primary Bedroom
- Breakfast Bar
- Traditional Architecture
- Community Pool
- Laundry Room
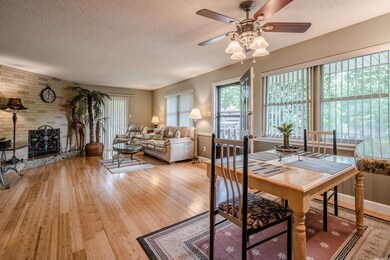
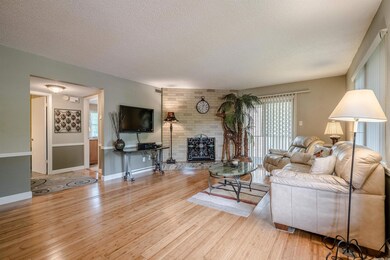
About This Home
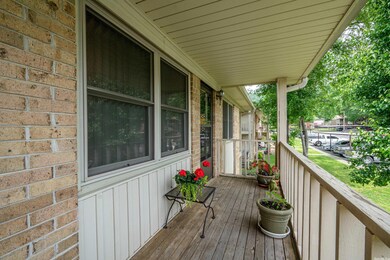
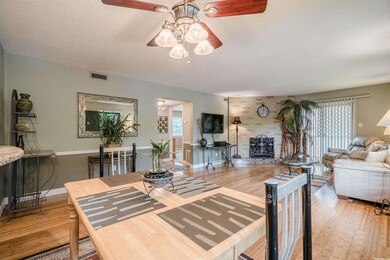
As of August 2024A rare find for this area. Updated and remodeled, low maintenance, convenient location to business and shopping. Lawn care and outside maintenance all taken care of. Perfect low priced starter home, investment property or vacation home. Granite countertops, decorative backsplash, and fireplace. Comes with all appliances and mostly furnished. This property is move in ready. Hurry since summer is almost here so you can move in and invite friends and family over for a house warming pool party!
Property Details
Home Type
- Condominium
Est. Annual Taxes
- $106
Year Built
- Built in 1975
HOA Fees
- $130 Monthly HOA Fees
Home Design
- Traditional Architecture
- Brick Exterior Construction
- Slab Foundation
- Architectural Shingle Roof
Interior Spaces
- 1,268 Sq Ft Home
- Wood Burning Fireplace
- Two Story Entrance Foyer
- Combination Dining and Living Room
Kitchen
- Breakfast Bar
- Electric Range
- Stove
- Microwave
Flooring
- Carpet
- Tile
Bedrooms and Bathrooms
- 2 Bedrooms
- Primary Bedroom on Main
- 2 Full Bathrooms
Laundry
- Laundry Room
- Washer Hookup
Parking
- 2 Car Garage
- Carport
Utilities
- Central Heating and Cooling System
- Electric Water Heater
Community Details
Recreation
- Community Pool
Additional Features
- Clubhouse
Ownership History
Date
Name
Owned For
Owner Type
Purchase Details
Closed on
Feb 22, 2006
Sold by
Moffatt William H and Moffatt Gwendolyn M
Bought by
Furo Samuel and Furo Sharon K
Home Financials for this Owner
Home Financials are based on the most recent Mortgage that was taken out on this home.
Original Mortgage
$57,000
Interest Rate
6.09%
Mortgage Type
New Conventional
Purchase Details
Closed on
Jan 13, 2006
Sold by
Not Provided
Bought by
Moffatt William H
Home Financials for this Owner
Home Financials are based on the most recent Mortgage that was taken out on this home.
Original Mortgage
$57,000
Interest Rate
6.09%
Mortgage Type
New Conventional
Purchase Details
Closed on
Nov 5, 1997
Sold by
Not Provided
Bought by
Moffatt Phyllis C
Purchase Details
Closed on
Aug 30, 1996
Sold by
Not Provided
Bought by
Cain I A and Cain Oldean
Purchase Details
Closed on
Jan 1, 1901
Bought by
Greenwood June and 200 Cooper Ln 7-A
Similar Homes in the area
Create a Home Valuation Report for This Property
The Home Valuation Report is an in-depth analysis detailing your home's value as well as a comparison with similar homes in the area
Home Values in the Area
Average Home Value in this Area
Purchase History
| Date | Type | Sale Price | Title Company |
|---|---|---|---|
| Warranty Deed | $72,000 | Hot Springs Title Company | |
| Executors Deed | $1,000 | -- | |
| Warranty Deed | $55,000 | -- | |
| Warranty Deed | $55,000 | -- | |
| Deed | -- | -- |
Source: Public Records
Mortgage History
| Date | Status | Loan Amount | Loan Type |
|---|---|---|---|
| Open | $15,000 | Credit Line Revolving | |
| Open | $44,913 | Stand Alone Refi Refinance Of Original Loan | |
| Closed | $57,000 | New Conventional |
Source: Public Records
Property History
| Date | Event | Price | Change | Sq Ft Price |
|---|---|---|---|---|
| 06/27/2025 06/27/25 | For Sale | $140,500 | +1.1% | $111 / Sq Ft |
| 05/24/2025 05/24/25 | Price Changed | $139,000 | -2.5% | $110 / Sq Ft |
| 03/28/2025 03/28/25 | For Sale | $142,500 | -5.0% | $112 / Sq Ft |
| 08/07/2024 08/07/24 | Sold | $150,000 | +22.0% | $118 / Sq Ft |
| 07/24/2024 07/24/24 | Pending | -- | -- | -- |
| 06/28/2024 06/28/24 | Sold | $123,000 | 0.0% | $97 / Sq Ft |
| 06/06/2024 06/06/24 | Pending | -- | -- | -- |
| 06/04/2024 06/04/24 | For Sale | $123,000 | -18.0% | $97 / Sq Ft |
| 04/17/2024 04/17/24 | For Sale | $150,000 | +20.0% | $118 / Sq Ft |
| 09/26/2023 09/26/23 | Sold | $125,000 | -10.1% | $99 / Sq Ft |
| 09/20/2023 09/20/23 | Pending | -- | -- | -- |
| 09/03/2023 09/03/23 | For Sale | $139,000 | +15.8% | $110 / Sq Ft |
| 03/03/2023 03/03/23 | Sold | $120,000 | -4.8% | $95 / Sq Ft |
| 01/28/2023 01/28/23 | For Sale | $126,000 | +26.0% | $99 / Sq Ft |
| 07/27/2022 07/27/22 | Sold | $100,000 | 0.0% | $79 / Sq Ft |
| 06/17/2022 06/17/22 | Pending | -- | -- | -- |
| 05/08/2022 05/08/22 | Pending | -- | -- | -- |
| 05/07/2022 05/07/22 | Off Market | $100,000 | -- | -- |
| 05/06/2022 05/06/22 | For Sale | $105,000 | +10.5% | $83 / Sq Ft |
| 04/05/2022 04/05/22 | Sold | $95,000 | 0.0% | $75 / Sq Ft |
| 04/05/2022 04/05/22 | Sold | $95,000 | 0.0% | $75 / Sq Ft |
| 03/07/2022 03/07/22 | Pending | -- | -- | -- |
| 03/06/2022 03/06/22 | For Sale | $95,000 | +26.7% | $75 / Sq Ft |
| 02/24/2022 02/24/22 | Sold | $75,000 | -6.3% | $59 / Sq Ft |
| 01/24/2022 01/24/22 | For Sale | $80,000 | +23.1% | $63 / Sq Ft |
| 01/18/2022 01/18/22 | Sold | $65,000 | +8.5% | $51 / Sq Ft |
| 12/20/2021 12/20/21 | Pending | -- | -- | -- |
| 12/16/2021 12/16/21 | For Sale | $59,900 | -36.9% | $47 / Sq Ft |
| 12/01/2021 12/01/21 | For Sale | $95,000 | +5.6% | $75 / Sq Ft |
| 11/12/2021 11/12/21 | Sold | $90,000 | -3.2% | $71 / Sq Ft |
| 09/16/2021 09/16/21 | Pending | -- | -- | -- |
| 09/11/2021 09/11/21 | For Sale | $93,000 | +55.0% | $73 / Sq Ft |
| 09/10/2020 09/10/20 | Sold | $60,000 | -4.0% | $46 / Sq Ft |
| 08/08/2020 08/08/20 | Pending | -- | -- | -- |
| 08/03/2020 08/03/20 | For Sale | $62,500 | -3.8% | $48 / Sq Ft |
| 07/17/2020 07/17/20 | Sold | $65,000 | -7.0% | $51 / Sq Ft |
| 06/22/2020 06/22/20 | Pending | -- | -- | -- |
| 04/09/2020 04/09/20 | For Sale | $69,900 | +7.5% | $55 / Sq Ft |
| 10/21/2019 10/21/19 | Sold | $65,000 | -7.0% | $51 / Sq Ft |
| 08/27/2019 08/27/19 | Pending | -- | -- | -- |
| 08/08/2019 08/08/19 | For Sale | $69,900 | +7.5% | $55 / Sq Ft |
| 07/17/2019 07/17/19 | Pending | -- | -- | -- |
| 07/16/2019 07/16/19 | Sold | $65,000 | +8.3% | $51 / Sq Ft |
| 06/17/2019 06/17/19 | Sold | $60,000 | -12.4% | $47 / Sq Ft |
| 06/04/2019 06/04/19 | For Sale | $68,500 | -2.1% | $54 / Sq Ft |
| 05/21/2019 05/21/19 | Pending | -- | -- | -- |
| 04/25/2019 04/25/19 | For Sale | $70,000 | +9.4% | $55 / Sq Ft |
| 03/18/2019 03/18/19 | Sold | $64,000 | +20.8% | $50 / Sq Ft |
| 02/12/2019 02/12/19 | Sold | $53,000 | -22.6% | $42 / Sq Ft |
| 01/24/2019 01/24/19 | For Sale | $68,500 | +24.5% | $54 / Sq Ft |
| 01/23/2019 01/23/19 | Price Changed | $55,000 | -7.9% | $43 / Sq Ft |
| 09/15/2018 09/15/18 | Price Changed | $59,700 | -3.6% | $47 / Sq Ft |
| 08/02/2018 08/02/18 | Price Changed | $61,900 | -5.5% | $49 / Sq Ft |
| 06/19/2018 06/19/18 | For Sale | $65,500 | +39.4% | $52 / Sq Ft |
| 05/18/2017 05/18/17 | Sold | $47,000 | -27.7% | $37 / Sq Ft |
| 04/18/2017 04/18/17 | Pending | -- | -- | -- |
| 07/22/2015 07/22/15 | Sold | $65,000 | -7.0% | $51 / Sq Ft |
| 06/22/2015 06/22/15 | Pending | -- | -- | -- |
| 04/29/2015 04/29/15 | For Sale | $69,900 | -- | $55 / Sq Ft |
Source: Cooperative Arkansas REALTORS® MLS
Tax History Compared to Growth
Tax History
| Year | Tax Paid | Tax Assessment Tax Assessment Total Assessment is a certain percentage of the fair market value that is determined by local assessors to be the total taxable value of land and additions on the property. | Land | Improvement |
|---|---|---|---|---|
| 2024 | -- | $18,560 | $0 | $18,560 |
| 2023 | $0 | $18,560 | $0 | $18,560 |
| 2022 | $412 | $18,560 | $0 | $18,560 |
| 2021 | $416 | $11,690 | $0 | $11,690 |
| 2020 | $41 | $11,690 | $0 | $11,690 |
| 2019 | $41 | $11,690 | $0 | $11,690 |
| 2018 | $66 | $11,690 | $0 | $11,690 |
| 2017 | $90 | $11,690 | $0 | $11,690 |
| 2016 | $90 | $12,370 | $0 | $12,370 |
| 2015 | $26 | $12,370 | $0 | $12,370 |
| 2014 | $26 | $9,109 | $0 | $0 |
Source: Public Records
Agents Affiliated with this Home
-
Kristi Williams
K
Seller's Agent in 2025
Kristi Williams
Southern Homes Realty - Hot Springs
(501) 520-1006
19 Total Sales
-
Blanche Thornhill
Seller's Agent in 2025
Blanche Thornhill
CENTURY 21 H.S.V. Realty
(501) 984-0911
91 Total Sales
-
Tracey Wheelington
Seller's Agent in 2024
Tracey Wheelington
White Stone Real Estate
(501) 318-3464
145 Total Sales
-
Tara Norwood
Seller's Agent in 2024
Tara Norwood
CBRPM Hot Springs
(501) 802-1755
126 Total Sales
-
Marianne Bird
Buyer's Agent in 2024
Marianne Bird
McGraw Realtors - HS
(501) 881-3331
21 Total Sales
-
Jon Rowley
Buyer Co-Listing Agent in 2024
Jon Rowley
McGraw Realtors - HS
(501) 620-3392
38 Total Sales
Map
Source: Cooperative Arkansas REALTORS® MLS
MLS Number: 22014775
APN: 045019
Disclaimer: Certain information contained herein is derived from information provided by parties other than Homes.com. All information provided is deemed reliable, but is not guaranteed to be accurate and should be independently verified.
![]() IDX information is provided exclusively for personal, non-commercial use, and may not be used for any purpose other than to identify prospective properties consumers may be interested in purchasing.
IDX information is provided exclusively for personal, non-commercial use, and may not be used for any purpose other than to identify prospective properties consumers may be interested in purchasing.
Nearby Homes
- 220 Cooper St Unit 6D
- 220 Cooper Cooper St Unit C6
- 160 Cooper St
- 160 Cooper St Unit B-17
- 201 Sunset St
- 1647 Hobson Ave
- 335 Mason St
- 113 Wynn St
- 105 Baber St
- 210 Jeffries St
- 212 Jeffries St
- 206 Richard St
- 00 Poinsettia St
- 1 Airport Rd
- 111 Camellia St
- 111 Brenda St
- 204 Brenda St
- 102 Burroughs St
- 105 Burroughs St
- 602 Richard St