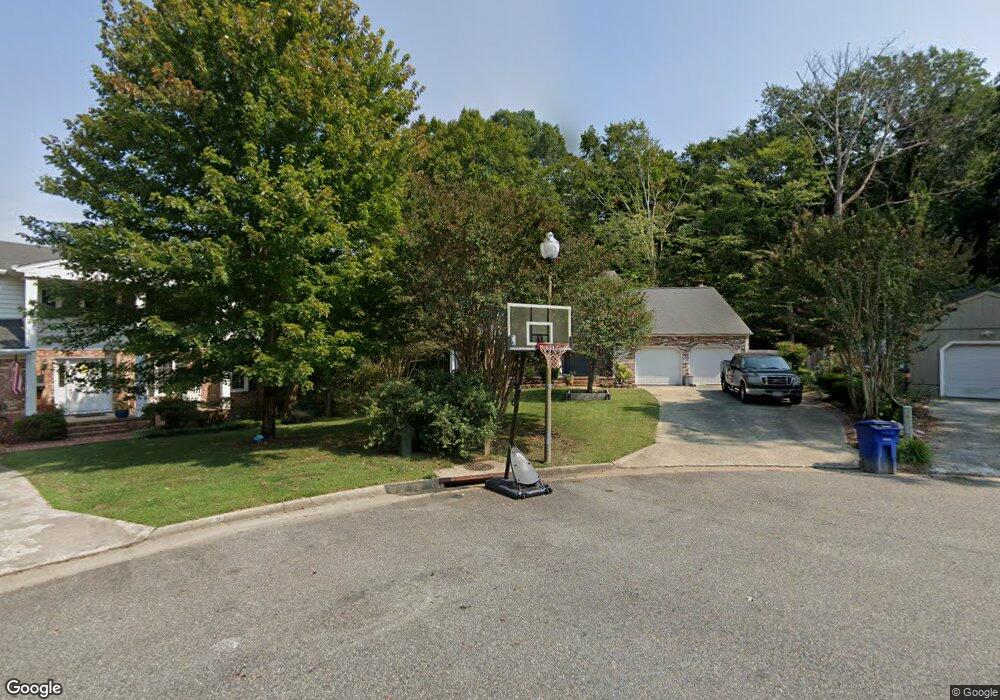
220 Cornell Dr Newport News, VA 23608
Nelson NeighborhoodEstimated Value: $425,000 - $479,566
5
Beds
3
Baths
2,373
Sq Ft
$190/Sq Ft
Est. Value
About This Home
This home is located at 220 Cornell Dr, Newport News, VA 23608 and is currently estimated at $450,892, approximately $190 per square foot. 220 Cornell Dr is a home located in Newport News City with nearby schools including Knollwood Meadows Elementary School, Mary Passage Middle School, and Denbigh High School.
Ownership History
Date
Name
Owned For
Owner Type
Purchase Details
Closed on
Mar 12, 2019
Sold by
Collins James Evans
Bought by
Barksdale Harvey and Barksdale Erin
Current Estimated Value
Home Financials for this Owner
Home Financials are based on the most recent Mortgage that was taken out on this home.
Original Mortgage
$294,405
Outstanding Balance
$258,307
Interest Rate
4.4%
Mortgage Type
New Conventional
Estimated Equity
$192,585
Purchase Details
Closed on
Aug 15, 2007
Sold by
Ordway Lawrence P
Bought by
Collins James Evans and Collins,Penny N
Home Financials for this Owner
Home Financials are based on the most recent Mortgage that was taken out on this home.
Original Mortgage
$318,000
Interest Rate
6.67%
Mortgage Type
New Conventional
Purchase Details
Closed on
Oct 6, 1998
Sold by
Mcnally Eugene H
Bought by
Ordway Lawrence P
Home Financials for this Owner
Home Financials are based on the most recent Mortgage that was taken out on this home.
Original Mortgage
$116,800
Interest Rate
6.68%
Create a Home Valuation Report for This Property
The Home Valuation Report is an in-depth analysis detailing your home's value as well as a comparison with similar homes in the area
Home Values in the Area
Average Home Value in this Area
Purchase History
| Date | Buyer | Sale Price | Title Company |
|---|---|---|---|
| Barksdale Harvey | $309,900 | Sage Title Group Llc | |
| Collins James Evans | $335,000 | -- | |
| Ordway Lawrence P | $196,000 | -- |
Source: Public Records
Mortgage History
| Date | Status | Borrower | Loan Amount |
|---|---|---|---|
| Open | Barksdale Harvey | $294,405 | |
| Previous Owner | Collins James Evans | $318,000 | |
| Previous Owner | Ordway Lawrence P | $116,800 |
Source: Public Records
Tax History Compared to Growth
Tax History
| Year | Tax Paid | Tax Assessment Tax Assessment Total Assessment is a certain percentage of the fair market value that is determined by local assessors to be the total taxable value of land and additions on the property. | Land | Improvement |
|---|---|---|---|---|
| 2025 | $5,350 | $462,000 | $90,000 | $372,000 |
| 2024 | $5,203 | $440,900 | $90,000 | $350,900 |
| 2023 | $5,153 | $424,200 | $90,000 | $334,200 |
| 2022 | $4,611 | $372,000 | $78,000 | $294,000 |
| 2021 | $3,987 | $326,800 | $78,000 | $248,800 |
| 2020 | $3,906 | $308,100 | $78,000 | $230,100 |
| 2019 | $3,484 | $275,700 | $78,000 | $197,700 |
| 2018 | $3,389 | $268,100 | $78,000 | $190,100 |
| 2017 | $3,277 | $257,200 | $78,000 | $179,200 |
| 2016 | $3,273 | $257,200 | $78,000 | $179,200 |
| 2015 | $3,248 | $257,200 | $78,000 | $179,200 |
| 2014 | $2,960 | $257,200 | $78,000 | $179,200 |
Source: Public Records
Map
Nearby Homes