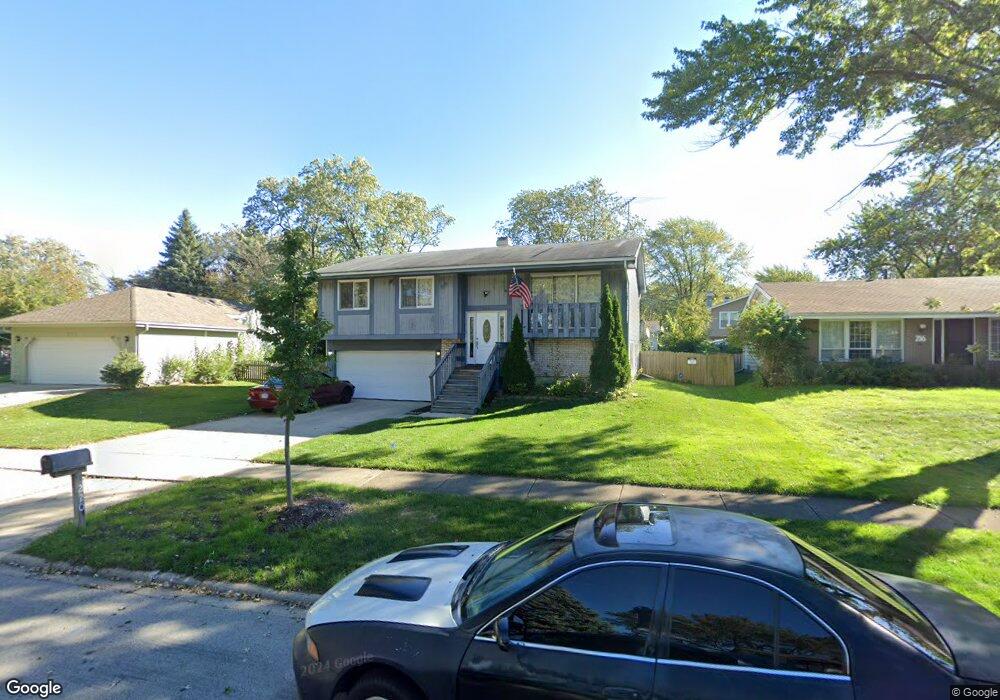
220 Flagstaff Dr Unit 5 Bolingbrook, IL 60440
East Bolingbrook NeighborhoodEstimated Value: $290,000 - $326,000
4
Beds
2
Baths
1,095
Sq Ft
$284/Sq Ft
Est. Value
About This Home
This home is located at 220 Flagstaff Dr Unit 5, Bolingbrook, IL 60440 and is currently estimated at $310,590, approximately $283 per square foot. 220 Flagstaff Dr Unit 5 is a home located in Will County with nearby schools including Oak View Elementary School, Bolingbrook High School, and Midwest Christian Montessori Academy.
Ownership History
Date
Name
Owned For
Owner Type
Purchase Details
Closed on
May 3, 2011
Sold by
Lustyk Thomas C and Lustyk Darcy E
Bought by
Owona Jean C
Current Estimated Value
Home Financials for this Owner
Home Financials are based on the most recent Mortgage that was taken out on this home.
Original Mortgage
$88,000
Outstanding Balance
$61,156
Interest Rate
4.88%
Mortgage Type
New Conventional
Estimated Equity
$249,434
Purchase Details
Closed on
Oct 27, 2000
Sold by
Albertsen Ron A and Albertsen Lynn M
Bought by
Lustyk Thomas C and Lustyk Darcy E
Home Financials for this Owner
Home Financials are based on the most recent Mortgage that was taken out on this home.
Original Mortgage
$141,820
Interest Rate
7.87%
Mortgage Type
FHA
Purchase Details
Closed on
May 15, 1998
Sold by
Sanders Donna M
Bought by
Albertsen Ron A and Albertsen Lynn M
Home Financials for this Owner
Home Financials are based on the most recent Mortgage that was taken out on this home.
Original Mortgage
$119,480
Interest Rate
7.19%
Mortgage Type
VA
Purchase Details
Closed on
Jan 26, 1994
Sold by
Kubik Mildred S
Bought by
Sanders Donna M
Create a Home Valuation Report for This Property
The Home Valuation Report is an in-depth analysis detailing your home's value as well as a comparison with similar homes in the area
Home Values in the Area
Average Home Value in this Area
Purchase History
| Date | Buyer | Sale Price | Title Company |
|---|---|---|---|
| Owona Jean C | $111,000 | First American Title | |
| Lustyk Thomas C | $146,000 | -- | |
| Albertsen Ron A | $116,000 | -- | |
| Sanders Donna M | -- | Plm Title Company |
Source: Public Records
Mortgage History
| Date | Status | Borrower | Loan Amount |
|---|---|---|---|
| Open | Owona Jean C | $88,000 | |
| Previous Owner | Lustyk Thomas C | $141,820 | |
| Previous Owner | Albertsen Ron A | $119,480 |
Source: Public Records
Tax History Compared to Growth
Tax History
| Year | Tax Paid | Tax Assessment Tax Assessment Total Assessment is a certain percentage of the fair market value that is determined by local assessors to be the total taxable value of land and additions on the property. | Land | Improvement |
|---|---|---|---|---|
| 2024 | $7,721 | $91,596 | $20,374 | $71,222 |
| 2023 | $7,721 | $82,415 | $18,332 | $64,083 |
| 2022 | $6,537 | $72,137 | $16,046 | $56,091 |
| 2021 | $6,186 | $67,449 | $15,003 | $52,446 |
| 2020 | $5,991 | $65,231 | $14,510 | $50,721 |
| 2019 | $5,791 | $62,125 | $13,819 | $48,306 |
| 2018 | $5,432 | $58,295 | $12,967 | $45,328 |
| 2017 | $5,163 | $55,256 | $12,291 | $42,965 |
| 2016 | $5,004 | $52,600 | $11,700 | $40,900 |
| 2015 | $4,927 | $50,400 | $11,200 | $39,200 |
| 2014 | $4,927 | $50,400 | $11,200 | $39,200 |
| 2013 | $4,927 | $47,100 | $10,500 | $36,600 |
Source: Public Records
Map
Nearby Homes
- 208 Flagstaff Dr
- 534 Cottonwood Cir
- 228 Elkhorn Ct Unit B
- 557 Cottonwood Cir
- 141 N Lancaster Dr
- 565 Cottonwood Cir
- 316 Pueblo Dr
- 623 Cochise Cir
- 261 Bryant Way
- 329 Redwing Dr
- 117 Galewood Dr
- 118 Springleaf Dr Unit 5
- 352 Gehrig Cir
- 129 Galewood Dr
- 412 Clifton Ln
- 135 Springleaf Dr
- 164 Galewood Dr
- 210 Mill Stream Dr
- 353 Foster Way Unit 2
- 23 Wildwood Ln Unit G
- 216 Flagstaff Dr
- 222 Flagstaff Dr
- 225 N Schmidt Rd
- 229 N Schmidt Rd
- 221 N Schmidt Rd
- 212 Flagstaff Dr
- 221 Flagstaff Dr
- 233 N Schmidt Rd
- 509 Blackhawk Ln
- 217 N Schmidt Rd
- 217 Flagstaff Dr
- 505 Blackhawk Ln Unit 5
- 517 Blackhawk Ln
- 213 Flagstaff Dr
- 213 N Schmidt Rd
- 501 Blackhawk Ln
- 521 Blackhawk Ln Unit 5
- 204 Flagstaff Dr
- 209 Flagstaff Dr
- 217 Kedvale Ct