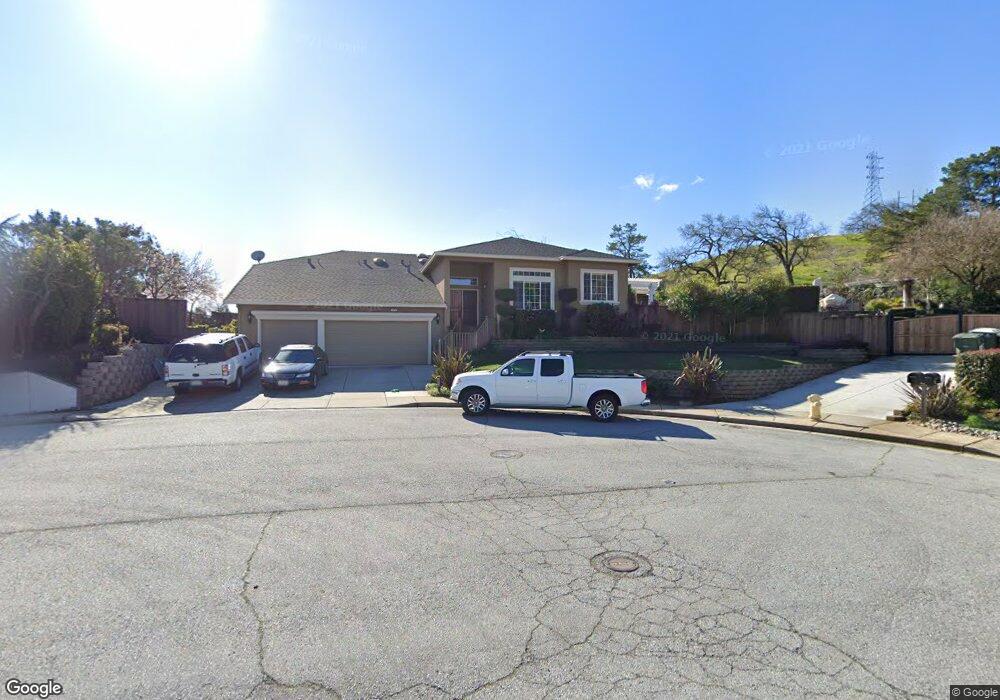
220 Foothill Ct Morgan Hill, CA 95037
Estimated Value: $1,262,000 - $1,561,964
4
Beds
2
Baths
2,200
Sq Ft
$630/Sq Ft
Est. Value
About This Home
This home is located at 220 Foothill Ct, Morgan Hill, CA 95037 and is currently estimated at $1,385,241, approximately $629 per square foot. 220 Foothill Ct is a home located in Santa Clara County with nearby schools including Barrett Elementary School, Britton Middle School, and Ann Sobrato High School.
Ownership History
Date
Name
Owned For
Owner Type
Purchase Details
Closed on
Oct 29, 2020
Sold by
Lacap Tedy and Lacap Christina M
Bought by
Lacap Revocable Living Trust and Lacap
Current Estimated Value
Home Financials for this Owner
Home Financials are based on the most recent Mortgage that was taken out on this home.
Original Mortgage
$626,000
Outstanding Balance
$558,051
Interest Rate
2.9%
Mortgage Type
New Conventional
Estimated Equity
$827,190
Purchase Details
Closed on
Aug 14, 2020
Sold by
Lacap Tedy and Lacap Christina M
Bought by
Lacap Tedy Viray and Lacap Christina Marie
Purchase Details
Closed on
Nov 13, 2015
Sold by
Lacap Tedy and Lacap Christina M
Bought by
Lacap Tedy and Lacap Christina M
Home Financials for this Owner
Home Financials are based on the most recent Mortgage that was taken out on this home.
Original Mortgage
$683,000
Interest Rate
3.71%
Mortgage Type
New Conventional
Purchase Details
Closed on
Nov 21, 2006
Sold by
Lacap Christina M and Lacap Tedy V
Bought by
Lacap Tedy and Lacap Christina M
Home Financials for this Owner
Home Financials are based on the most recent Mortgage that was taken out on this home.
Original Mortgage
$34,000
Interest Rate
6.33%
Mortgage Type
Credit Line Revolving
Purchase Details
Closed on
Sep 3, 2004
Sold by
Lacap Tedy V and Lacap Christina M
Bought by
Lacap Tedy and Lacap Christina M
Home Financials for this Owner
Home Financials are based on the most recent Mortgage that was taken out on this home.
Original Mortgage
$100,100
Interest Rate
6.06%
Mortgage Type
Credit Line Revolving
Purchase Details
Closed on
Jul 6, 1998
Sold by
Gera Construction Company Inc
Bought by
Cap Tedy V La and Marquez Christina M
Home Financials for this Owner
Home Financials are based on the most recent Mortgage that was taken out on this home.
Original Mortgage
$347,200
Interest Rate
7.03%
Mortgage Type
Balloon
Purchase Details
Closed on
Jun 19, 1998
Sold by
Marquez Ernest J
Bought by
Marquez Christina M
Home Financials for this Owner
Home Financials are based on the most recent Mortgage that was taken out on this home.
Original Mortgage
$347,200
Interest Rate
7.03%
Mortgage Type
Balloon
Purchase Details
Closed on
May 4, 1998
Sold by
Gera George and Gera Andrea
Bought by
Gera Construction Company Inc
Purchase Details
Closed on
Jun 24, 1997
Sold by
Gera Construction Company Inc
Bought by
Gera George
Create a Home Valuation Report for This Property
The Home Valuation Report is an in-depth analysis detailing your home's value as well as a comparison with similar homes in the area
Home Values in the Area
Average Home Value in this Area
Purchase History
| Date | Buyer | Sale Price | Title Company |
|---|---|---|---|
| Lacap Revocable Living Trust | -- | Cornerstone Title | |
| Lacap Tedy | -- | Cornerstone Title | |
| Lacap Tedy Viray | -- | None Available | |
| Lacap Tedy | -- | Old Republic Title Company | |
| Lacap Tedy | -- | Alliance Title Company | |
| Lacap Tedy | -- | Placer Title Company | |
| Cap Tedy V La | $434,000 | Commonwealth Land Title Co | |
| Marquez Christina M | -- | Commonwealth Land Title Co | |
| Gera Construction Company Inc | $434,000 | Commonwealth Land Title Co | |
| Gera George | -- | -- |
Source: Public Records
Mortgage History
| Date | Status | Borrower | Loan Amount |
|---|---|---|---|
| Open | Lacap Tedy | $626,000 | |
| Previous Owner | Lacap Tedy | $683,000 | |
| Previous Owner | Lacap Tedy | $34,000 | |
| Previous Owner | Lacap Tedy | $750,000 | |
| Previous Owner | Lacap Tedy | $100,100 | |
| Previous Owner | Cap Tedy V La | $347,200 | |
| Closed | Cap Tedy V La | $43,400 |
Source: Public Records
Tax History Compared to Growth
Tax History
| Year | Tax Paid | Tax Assessment Tax Assessment Total Assessment is a certain percentage of the fair market value that is determined by local assessors to be the total taxable value of land and additions on the property. | Land | Improvement |
|---|---|---|---|---|
| 2025 | $8,136 | $718,020 | $313,534 | $404,486 |
| 2024 | $8,136 | $703,942 | $307,387 | $396,555 |
| 2023 | $8,031 | $690,140 | $301,360 | $388,780 |
| 2022 | $7,897 | $676,608 | $295,451 | $381,157 |
| 2021 | $7,699 | $663,342 | $289,658 | $373,684 |
| 2020 | $7,514 | $656,541 | $286,688 | $369,853 |
| 2019 | $7,726 | $643,668 | $281,067 | $362,601 |
| 2018 | $7,750 | $631,048 | $275,556 | $355,492 |
| 2017 | $7,677 | $618,675 | $270,153 | $348,522 |
| 2016 | $7,190 | $606,545 | $264,856 | $341,689 |
| 2015 | $7,113 | $597,435 | $260,878 | $336,557 |
| 2014 | $7,212 | $585,733 | $255,768 | $329,965 |
Source: Public Records
Map
Nearby Homes
- 225 Spring Ave Unit 5
- 407 Scotts Bluff Place
- 260 W Dunne Ave Unit 20
- 260 W Dunne Ave Unit 18
- 16697 Lone Hill Dr
- 17120 Viewcrest Ln
- 85 W 5th St
- 385 W Dunne Ave
- 410 Farallon Dr
- 17050 Depot St
- 17050 Depot St Unit 300
- 17050 Depot St Unit 200
- 17068 Depot St
- 155 Nob Hill Terrace
- 17122 Depot St
- 17126 Depot St
- 17114 Depot St
- Plan 3 at The Lumberyard
- Plan 7 at The Lumberyard
- Plan 6 at The Lumberyard
- 16645 Del Monte Ave
- 235 Foothill Ct
- 16625 Del Monte Ave
- 16635 Del Monte Ave
- 225 Foothill Ct
- 215 Foothill Ct
- 16655 Del Monte Ave
- 16615 Del Monte Ave
- 16675 Del Monte Ave
- 220 Spring Ave
- 230 Spring Ave
- 210 Spring Ave
- 190 Foothill Ct
- 195 Mathilda Ct
- 200 Spring Ave
- 195 Foothill Ct
- 180 Foothill Ct
- 16535 Del Monte Ave
- 185 Foothill Ct
- 190 Spring Ave