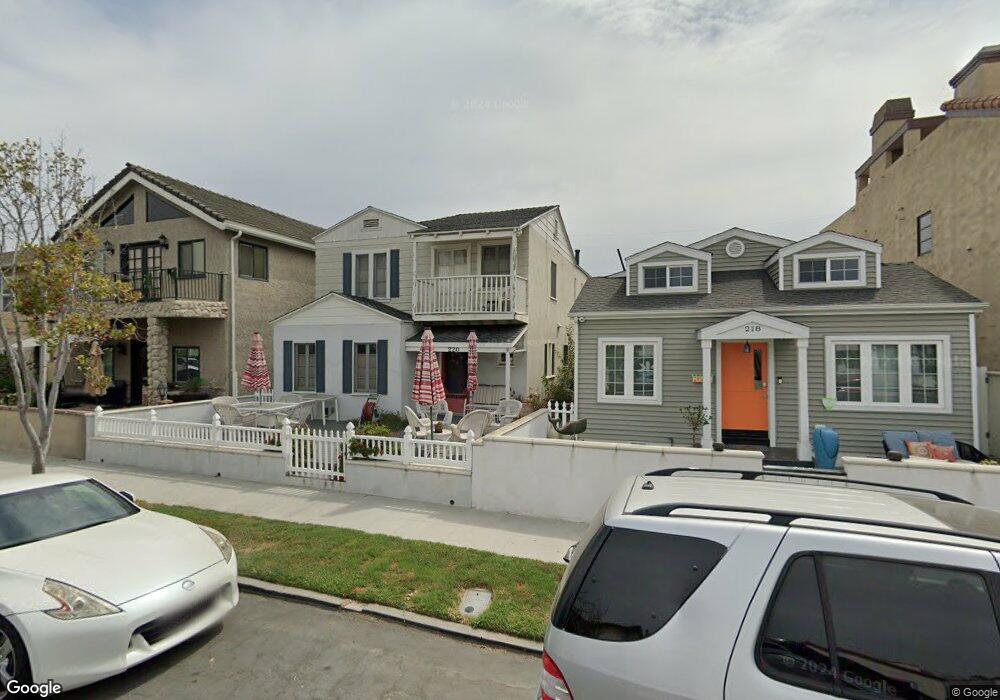
220 Glendora Ave Long Beach, CA 90803
Belmont Shore NeighborhoodEstimated Value: $1,433,000 - $1,788,000
4
Beds
3
Baths
2,166
Sq Ft
$763/Sq Ft
Est. Value
About This Home
This home is located at 220 Glendora Ave, Long Beach, CA 90803 and is currently estimated at $1,653,535, approximately $763 per square foot. 220 Glendora Ave is a home located in Los Angeles County with nearby schools including Lowell Elementary School, Rogers Middle School, and Woodrow Wilson High School.
Ownership History
Date
Name
Owned For
Owner Type
Purchase Details
Closed on
Oct 26, 2010
Sold by
Reusch Paul G and Reusch Janelle M
Bought by
Schmitt Susan J and Susan J Schmitt Trust
Current Estimated Value
Home Financials for this Owner
Home Financials are based on the most recent Mortgage that was taken out on this home.
Original Mortgage
$417,000
Outstanding Balance
$273,725
Interest Rate
4.17%
Mortgage Type
New Conventional
Estimated Equity
$1,379,810
Purchase Details
Closed on
Jul 26, 2005
Sold by
Lohman Patricia L and Patricia L Lohman Revocable Tr
Bought by
Reusch Paul G
Home Financials for this Owner
Home Financials are based on the most recent Mortgage that was taken out on this home.
Original Mortgage
$711,200
Interest Rate
5.61%
Mortgage Type
New Conventional
Purchase Details
Closed on
Sep 23, 2003
Sold by
Lohman Patricia L and Pierce Richard Joseph
Bought by
Lohman Patricia L and Patricia L Lohman Revocable Trust
Create a Home Valuation Report for This Property
The Home Valuation Report is an in-depth analysis detailing your home's value as well as a comparison with similar homes in the area
Home Values in the Area
Average Home Value in this Area
Purchase History
| Date | Buyer | Sale Price | Title Company |
|---|---|---|---|
| Schmitt Susan J | $860,000 | North American Title Company | |
| Reusch Paul G | $889,000 | Fidelity National Title Co | |
| Lohman Patricia L | -- | -- |
Source: Public Records
Mortgage History
| Date | Status | Borrower | Loan Amount |
|---|---|---|---|
| Open | Schmitt Susan J | $417,000 | |
| Previous Owner | Reusch Paul G | $711,200 |
Source: Public Records
Tax History
| Year | Tax Paid | Tax Assessment Tax Assessment Total Assessment is a certain percentage of the fair market value that is determined by local assessors to be the total taxable value of land and additions on the property. | Land | Improvement |
|---|---|---|---|---|
| 2025 | $13,729 | $1,101,800 | $757,425 | $344,375 |
| 2024 | $13,729 | $1,080,197 | $742,574 | $337,623 |
| 2023 | $13,500 | $1,059,017 | $728,014 | $331,003 |
| 2022 | $12,661 | $1,038,253 | $713,740 | $324,513 |
| 2021 | $12,414 | $1,017,896 | $699,746 | $318,150 |
| 2019 | $12,234 | $987,706 | $678,992 | $308,714 |
| 2018 | $11,926 | $968,340 | $665,679 | $302,661 |
| 2016 | $10,963 | $930,740 | $639,831 | $290,909 |
| 2015 | $10,514 | $916,761 | $630,221 | $286,540 |
| 2014 | $10,427 | $898,804 | $617,876 | $280,928 |
Source: Public Records
Map
Nearby Homes
- 215 Glendora Ave
- 207 Santa Ana Ave
- 229 La Verne Ave
- 237 Covina Ave
- 173 Glendora Ave
- 201 Bay Shore Ave Unit 104
- 158 Santa Ana Ave
- 143 Pomona Ave
- 265 Bay Shore Ave
- 220 Granada Ave
- 131 Santa Ana Ave
- 5400 E The Toledo Unit 701
- 5120 E Livingston Dr
- 5433 E The Toledo
- 153 Granada Ave
- 66 Pomona Ave
- 75 Claremont Ave
- 350 Pomona Ave
- 150 Saint Joseph Ave
- 40 Claremont Ave
- 222 Glendora Ave
- 218 Glendora Ave
- 216 Glendora Ave
- 221 Pomona Ave
- 214 Glendora Ave
- 223 Pomona Ave
- 217 Pomona Ave
- 225 Pomona Ave
- 212 Glendora Ave
- 215 Pomona Ave
- 221 Glendora Ave
- 223 Glendora Ave
- 219 Glendora Ave
- 217 Glendora Ave
- 225 Glendora Ave
- 213 Pomona Ave
- 228 Glendora Ave
- 210 Glendora Ave Unit 2
- 210 Glendora Ave
- 227 1/2 Glendora Ave
Your Personal Tour Guide
Ask me questions while you tour the home.