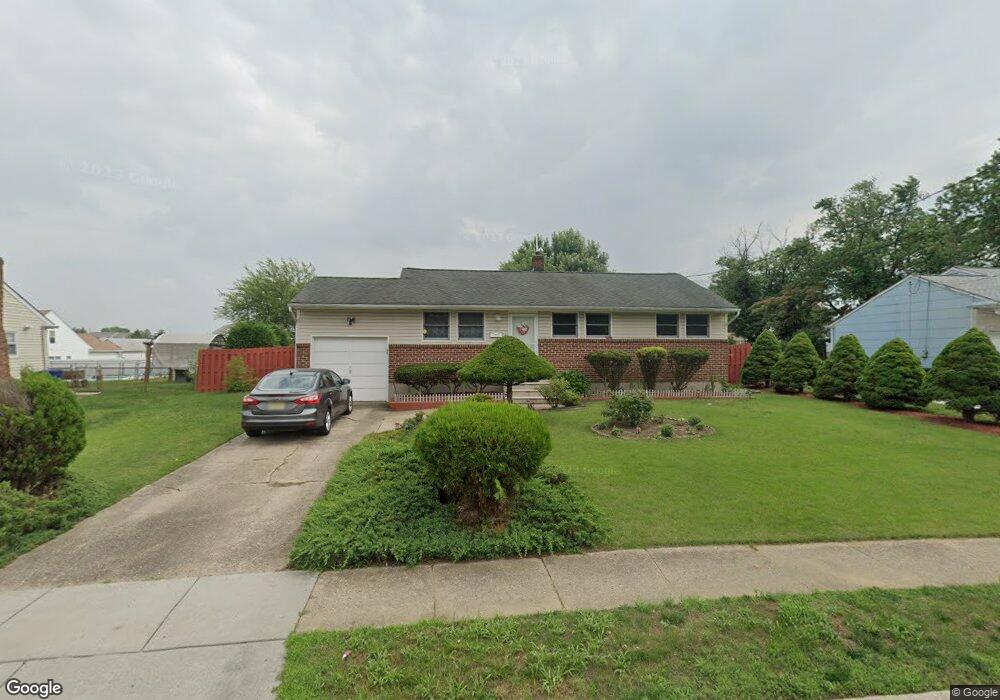
220 Ivy Rd Beverly, NJ 08010
Estimated Value: $272,582 - $336,000
--
Bed
--
Bath
1,116
Sq Ft
$284/Sq Ft
Est. Value
About This Home
This home is located at 220 Ivy Rd, Beverly, NJ 08010 and is currently estimated at $316,396, approximately $283 per square foot. 220 Ivy Rd is a home located in Burlington County with nearby schools including Magowan Elementary School, Samuel M Ridgway School, and Benjamin Banneker Prep Charter School.
Ownership History
Date
Name
Owned For
Owner Type
Purchase Details
Closed on
May 24, 2010
Sold by
Madeja Marek
Bought by
Madeja Anna B
Current Estimated Value
Home Financials for this Owner
Home Financials are based on the most recent Mortgage that was taken out on this home.
Original Mortgage
$101,000
Interest Rate
4.43%
Mortgage Type
New Conventional
Purchase Details
Closed on
Aug 3, 2007
Sold by
Madeja Marek and Madeja Anna
Bought by
Madeja Marek and Madeja Anna
Purchase Details
Closed on
Aug 27, 1999
Sold by
Snively Christopher C and Snively Kimberly Dawn
Bought by
Madeja Marek and Madeja Anna
Home Financials for this Owner
Home Financials are based on the most recent Mortgage that was taken out on this home.
Original Mortgage
$114,941
Interest Rate
7.65%
Mortgage Type
FHA
Create a Home Valuation Report for This Property
The Home Valuation Report is an in-depth analysis detailing your home's value as well as a comparison with similar homes in the area
Home Values in the Area
Average Home Value in this Area
Purchase History
| Date | Buyer | Sale Price | Title Company |
|---|---|---|---|
| Madeja Anna B | -- | None Available | |
| Madeja Marek | -- | None Available | |
| Madeja Marek | $115,000 | Surety Title Corporation |
Source: Public Records
Mortgage History
| Date | Status | Borrower | Loan Amount |
|---|---|---|---|
| Closed | Madeja Anna B | $101,000 | |
| Closed | Madeja Marek | $114,941 |
Source: Public Records
Tax History Compared to Growth
Tax History
| Year | Tax Paid | Tax Assessment Tax Assessment Total Assessment is a certain percentage of the fair market value that is determined by local assessors to be the total taxable value of land and additions on the property. | Land | Improvement |
|---|---|---|---|---|
| 2025 | $6,019 | $173,600 | $67,500 | $106,100 |
| 2024 | $5,956 | $173,600 | $67,500 | $106,100 |
| 2023 | $5,956 | $173,600 | $67,500 | $106,100 |
| 2022 | $5,939 | $173,600 | $67,500 | $106,100 |
| 2021 | $5,845 | $173,600 | $67,500 | $106,100 |
| 2020 | $5,654 | $173,600 | $67,500 | $106,100 |
| 2019 | $6,123 | $199,000 | $73,500 | $125,500 |
| 2018 | $5,988 | $199,000 | $73,500 | $125,500 |
| 2017 | $5,874 | $199,000 | $73,500 | $125,500 |
| 2016 | $5,546 | $199,000 | $73,500 | $125,500 |
| 2015 | $5,343 | $199,000 | $73,500 | $125,500 |
| 2014 | $5,055 | $199,000 | $73,500 | $125,500 |
Source: Public Records
Map
Nearby Homes
- 205 S Garden Blvd
- 58 Benford Ln
- 204 N Garden
- 25 L Wendowski St
- 20 Benford Ln
- 26 L Wendowski St
- 402 S Arthur Dr
- 400 S Arthur Dr
- 1294 Cooper St Unit E3
- 1294 Cooper St Unit E8
- 1294 Cooper St Unit E13
- 1294 Cooper St Unit C06
- 424 Jefferson Ave
- 129 Green St
- 206 Colonial Rd
- 208 Regency Rd
- 202 Buchanan Ave
- 59 Somerset Dr
- 123 E Franklin Ave
- 1000 Cooper St