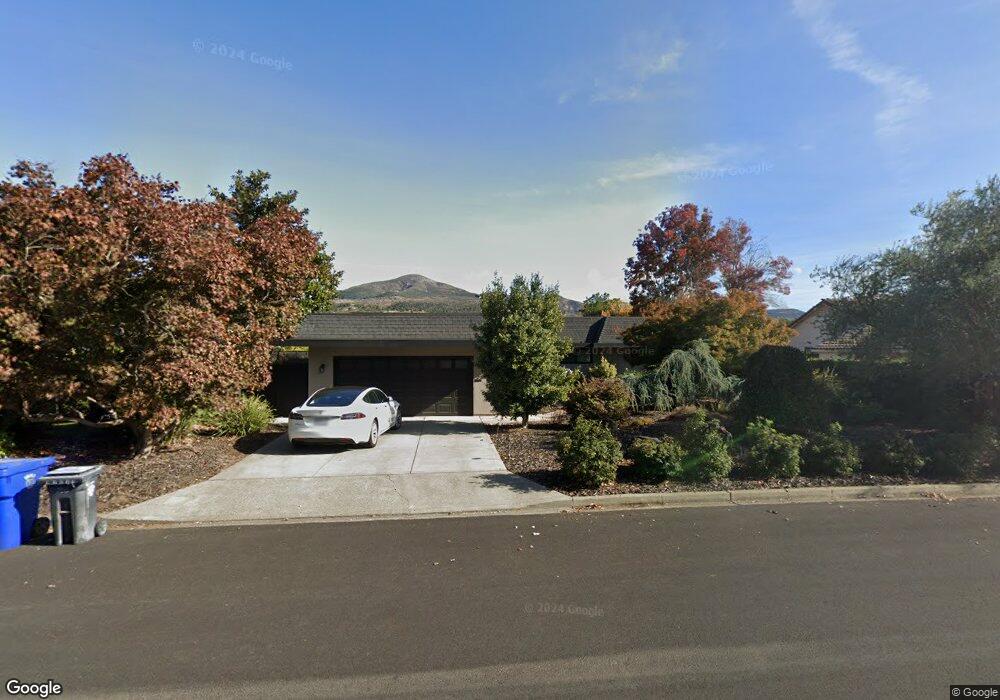
220 Kaanapali Dr Napa, CA 94558
Silverado Resort NeighborhoodEstimated Value: $2,057,530 - $2,196,000
4
Beds
4
Baths
2,377
Sq Ft
$903/Sq Ft
Est. Value
About This Home
This home is located at 220 Kaanapali Dr, Napa, CA 94558 and is currently estimated at $2,146,633, approximately $903 per square foot. 220 Kaanapali Dr is a home located in Napa County with nearby schools including Vichy Elementary School, Silverado Middle School, and Vintage High School.
Ownership History
Date
Name
Owned For
Owner Type
Purchase Details
Closed on
Apr 22, 2025
Sold by
Keller Family Trust and Keller James
Bought by
Wilcox Justin and Wilcox Jennifer
Current Estimated Value
Home Financials for this Owner
Home Financials are based on the most recent Mortgage that was taken out on this home.
Original Mortgage
$600,000
Outstanding Balance
$597,337
Interest Rate
6.65%
Mortgage Type
New Conventional
Estimated Equity
$1,549,296
Purchase Details
Closed on
Feb 9, 2023
Sold by
Mary Belli Revocable Trust
Bought by
Keller Family Trust
Home Financials for this Owner
Home Financials are based on the most recent Mortgage that was taken out on this home.
Original Mortgage
$1,000,000
Interest Rate
6.33%
Mortgage Type
New Conventional
Purchase Details
Closed on
May 21, 2003
Sold by
Belli Mary
Bought by
Belli Mary and The Mary Belli Revocable Trust
Purchase Details
Closed on
Jan 23, 2003
Sold by
Belli Mary and Cohen Arthur M
Bought by
Belli Mary
Create a Home Valuation Report for This Property
The Home Valuation Report is an in-depth analysis detailing your home's value as well as a comparison with similar homes in the area
Home Values in the Area
Average Home Value in this Area
Purchase History
| Date | Buyer | Sale Price | Title Company |
|---|---|---|---|
| Wilcox Justin | $2,210,000 | Placer Title | |
| Keller Family Trust | $1,924,000 | Old Republic Title | |
| Belli Mary | -- | -- | |
| Belli Mary | -- | -- |
Source: Public Records
Mortgage History
| Date | Status | Borrower | Loan Amount |
|---|---|---|---|
| Open | Wilcox Justin | $600,000 | |
| Previous Owner | Keller Family Trust | $1,000,000 |
Source: Public Records
Tax History Compared to Growth
Tax History
| Year | Tax Paid | Tax Assessment Tax Assessment Total Assessment is a certain percentage of the fair market value that is determined by local assessors to be the total taxable value of land and additions on the property. | Land | Improvement |
|---|---|---|---|---|
| 2025 | $22,548 | $2,001,729 | $1,300,500 | $701,229 |
| 2024 | $22,548 | $1,962,480 | $1,275,000 | $687,480 |
| 2023 | $22,548 | $412,984 | $128,050 | $284,934 |
| 2022 | $5,447 | $404,888 | $125,540 | $279,348 |
| 2021 | $5,366 | $396,950 | $123,079 | $273,871 |
| 2020 | $5,321 | $392,880 | $121,817 | $271,063 |
| 2019 | $5,218 | $385,178 | $119,429 | $265,749 |
| 2018 | $5,134 | $377,627 | $117,088 | $260,539 |
| 2017 | $4,997 | $370,224 | $114,793 | $255,431 |
| 2016 | $4,834 | $362,966 | $112,543 | $250,423 |
| 2015 | $4,496 | $357,515 | $110,853 | $246,662 |
| 2014 | $4,427 | $350,513 | $108,682 | $241,831 |
Source: Public Records
Map
Nearby Homes
- 265 Kaanapali Dr
- 2863 Atlas Peak Rd
- 2134 Monticello Rd
- 2015 Monticello Rd
- 1777 Mckinley Rd
- 2152 Monticello Rd
- 1600 Atlas Peak Rd Unit 432
- 1600 Atlas Peak Rd Unit 428
- 1600 Atlas Peak Rd Unit 365
- 2186 Monticello Rd
- 1101 Hedgeside Ave
- 2143 Monticello Rd
- 833 Augusta Cir Unit 34
- 1776 Monticello Rd
- 808 Augusta Cir
- 1597 Estee Ave
- 1079 Hedgeside Ave
- 1669 Atlas Peak Rd
- 2277 Monticello Rd
- 894 Oak Leaf Way
- 216 Kaanapali Dr
- 226 Kaanapali Dr
- 212 Kaanapali Dr
- 230 Kaanapali Dr
- 219 Kaanapali Dr
- 223 Kaanapali Dr
- 213 Kaanapali Dr
- 229 Kaanapali Dr
- 208 Kaanapali Dr
- 234 Kaanapali Dr
- 209 Kaanapali Dr
- 235 Kaanapali Dr
- 204 Kaanapali Dr
- 205 Kaanapali Dr
- 240 Kaanapali Dr
- 241 Kaanapali Dr
- 198 Kaanapali Dr
- 199 Kaanapali Dr
- 1547 Silver Trail
- 244 Kaanapali Dr