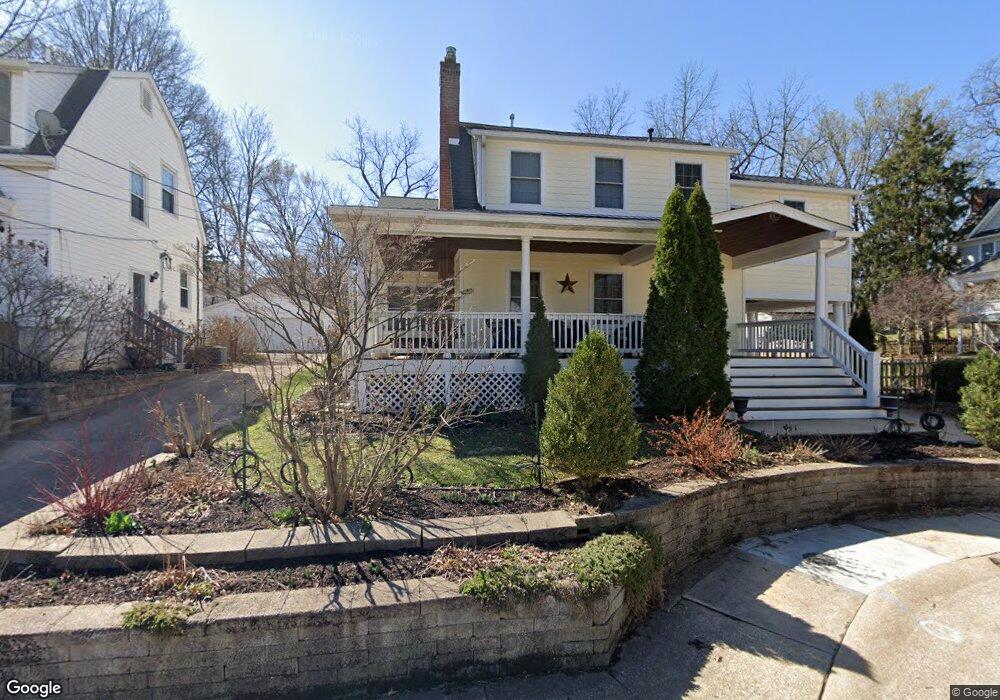
220 Kerruish Place Saint Louis, MO 63119
Estimated Value: $609,000 - $948,000
5
Beds
5
Baths
3,000
Sq Ft
$257/Sq Ft
Est. Value
About This Home
This home is located at 220 Kerruish Place, Saint Louis, MO 63119 and is currently estimated at $772,398, approximately $257 per square foot. 220 Kerruish Place is a home located in St. Louis County with nearby schools including Bristol Elementary School, Hixson Middle School, and Webster Groves High School.
Ownership History
Date
Name
Owned For
Owner Type
Purchase Details
Closed on
Feb 28, 2024
Sold by
Haug Lawrence P and Haug Colleen M
Bought by
Lawrence And Colleen Haug Trust and Haug
Current Estimated Value
Purchase Details
Closed on
Jan 29, 2016
Sold by
Haug Lawrence P and Haug Colleen M
Bought by
Haug Lawrence P and Haug Colleen M
Purchase Details
Closed on
Mar 12, 2015
Sold by
Haug Lawrence P and Haug Colleen M
Bought by
Lawrence & Colleen Haug Trust
Purchase Details
Closed on
May 28, 1999
Sold by
Miller James R
Bought by
Haug Lawrence P and Haug Colleen M
Home Financials for this Owner
Home Financials are based on the most recent Mortgage that was taken out on this home.
Original Mortgage
$140,000
Interest Rate
6.91%
Create a Home Valuation Report for This Property
The Home Valuation Report is an in-depth analysis detailing your home's value as well as a comparison with similar homes in the area
Home Values in the Area
Average Home Value in this Area
Purchase History
| Date | Buyer | Sale Price | Title Company |
|---|---|---|---|
| Lawrence And Colleen Haug Trust | -- | None Listed On Document | |
| Haug Lawrence P | -- | None Available | |
| Lawrence & Colleen Haug Trust | -- | None Available | |
| Haug Lawrence P | $220,000 | -- |
Source: Public Records
Mortgage History
| Date | Status | Borrower | Loan Amount |
|---|---|---|---|
| Previous Owner | Haug Lawrence P | $140,000 |
Source: Public Records
Tax History Compared to Growth
Tax History
| Year | Tax Paid | Tax Assessment Tax Assessment Total Assessment is a certain percentage of the fair market value that is determined by local assessors to be the total taxable value of land and additions on the property. | Land | Improvement |
|---|---|---|---|---|
| 2025 | $8,308 | $163,090 | $67,010 | $96,080 |
| 2024 | $8,308 | $119,800 | $46,080 | $73,720 |
| 2023 | $8,308 | $115,580 | $46,080 | $69,500 |
| 2022 | $9,027 | $121,550 | $46,080 | $75,470 |
| 2021 | $8,995 | $121,550 | $46,080 | $75,470 |
| 2020 | $8,709 | $109,610 | $51,930 | $57,680 |
| 2019 | $8,646 | $109,610 | $51,930 | $57,680 |
| 2018 | $9,779 | $110,190 | $41,880 | $68,310 |
| 2017 | $9,714 | $110,190 | $41,880 | $68,310 |
| 2016 | $7,602 | $82,390 | $33,520 | $48,870 |
| 2015 | $7,645 | $82,390 | $33,520 | $48,870 |
| 2014 | $9,202 | $96,560 | $16,090 | $80,470 |
Source: Public Records
Map
Nearby Homes
- 342 E Swon Ave
- 226 E Lockwood Ave Unit 115
- 8361 Big Bend Blvd
- 203 E Jackson Rd
- 426 Pasadena Ave
- 125 E Frisco Ave
- 426 S Maple Ave
- 368 S Gore Ave
- 156 Gray Ave
- 340 Gray Ave
- 514 S Gore Ave
- 200 Blackmer Place
- 441 Park Rd
- 144 S Rock Hill Rd
- 431 Landscape Ct
- 717 Yale Ave
- 423 S Old Orchard Ave
- 404 W Kirkham Ave
- 435 S Old Orchard Ave
- 511 Fairview Ave
- 224 Kerruish Place
- 228 Kerruish Place
- 136 Plant Ave
- 130 Plant Ave
- 152 Plant Ave
- 219 E Swon Ave
- 215 Kerruish Place
- 221 Kerruish Place
- 159 Sylvester Ave
- 229 Kerruish Place
- 126 Plant Ave
- 215 E Swon Ave
- 225 E Swon Ave
- 137 Sylvester Ave
- 131 Sylvester Ave
- 231 Kerruish Place
- 122 Plant Ave
- 235 Kerruish Place
- 239 E Swon Ave
- 237 Kerruish Place