Estimated Value: $153,000 - $186,558
4
Beds
2
Baths
1,225
Sq Ft
$141/Sq Ft
Est. Value
About This Home
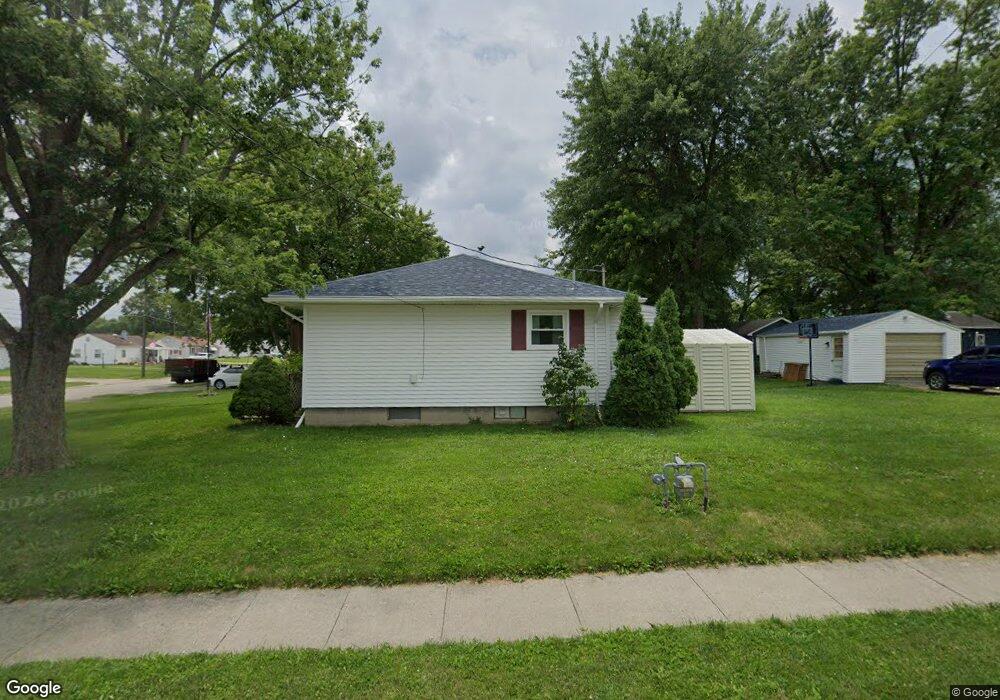
This home is located at 220 Lyndhurst Dr, Piqua, OH 45356 and is currently estimated at $172,140, approximately $140 per square foot. 220 Lyndhurst Dr is a home located in Miami County with nearby schools including Washington Primary School, Piqua Junior High School, and Piqua High School.
Ownership History
Date
Name
Owned For
Owner Type
Purchase Details
Closed on
Nov 22, 2019
Sold by
American Land Investments Ltd
Bought by
Farkas Christopher A
Current Estimated Value
Home Financials for this Owner
Home Financials are based on the most recent Mortgage that was taken out on this home.
Original Mortgage
$97,655
Outstanding Balance
$86,166
Interest Rate
3.75%
Mortgage Type
VA
Estimated Equity
$85,974
Purchase Details
Closed on
Sep 9, 2008
Sold by
Garke Barbara and Bey Marvin
Bought by
American Land Investments Ltd
Purchase Details
Closed on
Jul 14, 2003
Sold by
Gaier Lucille M
Bought by
Garke Barbara and Bey Marvin
Purchase Details
Closed on
Sep 1, 1984
Bought by
Gaier Clarence J
Create a Home Valuation Report for This Property
The Home Valuation Report is an in-depth analysis detailing your home's value as well as a comparison with similar homes in the area
Home Values in the Area
Average Home Value in this Area
Purchase History
| Date | Buyer | Sale Price | Title Company |
|---|---|---|---|
| Farkas Christopher A | $95,600 | None Available | |
| American Land Investments Ltd | $62,000 | -- | |
| Garke Barbara | -- | -- | |
| Gaier Clarence J | $23,000 | -- |
Source: Public Records
Mortgage History
| Date | Status | Borrower | Loan Amount |
|---|---|---|---|
| Open | Farkas Christopher A | $97,655 |
Source: Public Records
Tax History Compared to Growth
Tax History
| Year | Tax Paid | Tax Assessment Tax Assessment Total Assessment is a certain percentage of the fair market value that is determined by local assessors to be the total taxable value of land and additions on the property. | Land | Improvement |
|---|---|---|---|---|
| 2024 | $1,843 | $44,840 | $10,710 | $34,130 |
| 2023 | $1,843 | $44,840 | $10,710 | $34,130 |
| 2022 | $1,875 | $44,840 | $10,710 | $34,130 |
| 2021 | $1,519 | $33,220 | $7,950 | $25,270 |
| 2020 | $1,488 | $33,220 | $7,950 | $25,270 |
| 2019 | $1,535 | $33,220 | $7,950 | $25,270 |
| 2018 | $1,321 | $27,240 | $7,950 | $19,290 |
| 2017 | $1,337 | $27,240 | $7,950 | $19,290 |
| 2016 | $1,323 | $27,240 | $7,950 | $19,290 |
| 2015 | $1,354 | $27,240 | $7,950 | $19,290 |
| 2014 | $1,354 | $27,240 | $7,950 | $19,290 |
| 2013 | $1,359 | $27,240 | $7,950 | $19,290 |
Source: Public Records
Map
Nearby Homes
- 218 Lyndhurst Dr
- 216 Lyndhurst Dr
- 1306 W High St
- 219 Lyndhurst Dr
- 1300 W High St
- 217 Lyndhurst Dr
- 1313 W High St
- 214 Lyndhurst Dr
- 215 Lyndhurst Dr
- 1308 W High St
- 209 Maryville Ln
- 213 Lyndhurst Dr
- 212 Lyndhurst Dr
- 1256 W High St
- 1254 W High St
- 1233 Marwood Dr
- 207 Maryville Ln
- 1401 W High St
- 1252 W High St
- 211 Lyndhurst Dr