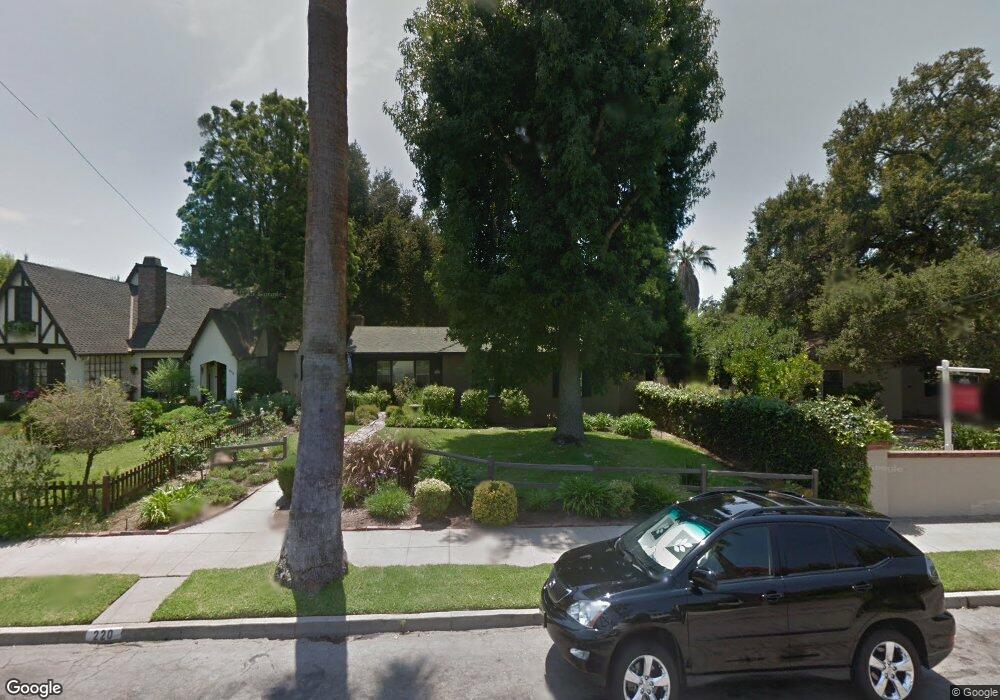
220 Monroe Place Monrovia, CA 91016
Estimated Value: $899,777 - $1,199,000
2
Beds
1
Bath
1,246
Sq Ft
$870/Sq Ft
Est. Value
About This Home
This home is located at 220 Monroe Place, Monrovia, CA 91016 and is currently estimated at $1,083,444, approximately $869 per square foot. 220 Monroe Place is a home located in Los Angeles County with nearby schools including Mayflower Elementary School, Clifton Middle School, and Monrovia High School.
Ownership History
Date
Name
Owned For
Owner Type
Purchase Details
Closed on
Jun 28, 2023
Sold by
Perez Shirley Louise
Bought by
Shirley L Perez Revocable Trust and Perez
Current Estimated Value
Purchase Details
Closed on
May 13, 2023
Sold by
Shirley L Perez Revocable Trust
Bought by
Perez Alissa J and Welch Zackary
Purchase Details
Closed on
Oct 19, 2018
Sold by
Perez Shirley L
Bought by
Perez Shirley L and Shirley L Perez Revocable Trus
Purchase Details
Closed on
Sep 4, 2014
Sold by
Perez Jose A
Bought by
Perez Jose A and Perez Shirley L
Purchase Details
Closed on
Jan 27, 2011
Sold by
Perez Jose A and Perez Shirley L
Bought by
Perez Jose A and Perez Shirley L
Home Financials for this Owner
Home Financials are based on the most recent Mortgage that was taken out on this home.
Original Mortgage
$200,000
Interest Rate
4.82%
Mortgage Type
New Conventional
Create a Home Valuation Report for This Property
The Home Valuation Report is an in-depth analysis detailing your home's value as well as a comparison with similar homes in the area
Home Values in the Area
Average Home Value in this Area
Purchase History
| Date | Buyer | Sale Price | Title Company |
|---|---|---|---|
| Shirley L Perez Revocable Trust | -- | -- | |
| Perez Alissa J | -- | None Listed On Document | |
| Perez Shirley L | -- | None Available | |
| Perez Jose A | -- | None Available | |
| Perez Jose A | -- | Lawyers Title |
Source: Public Records
Mortgage History
| Date | Status | Borrower | Loan Amount |
|---|---|---|---|
| Previous Owner | Perez Jose A | $200,000 |
Source: Public Records
Tax History
| Year | Tax Paid | Tax Assessment Tax Assessment Total Assessment is a certain percentage of the fair market value that is determined by local assessors to be the total taxable value of land and additions on the property. | Land | Improvement |
|---|---|---|---|---|
| 2025 | $5,250 | $381,047 | $262,760 | $118,287 |
| 2024 | $5,250 | $373,576 | $257,608 | $115,968 |
| 2023 | $5,038 | $359,071 | $247,605 | $111,466 |
| 2022 | $4,893 | $352,031 | $242,750 | $109,281 |
| 2021 | $4,794 | $345,130 | $237,991 | $107,139 |
| 2019 | $4,657 | $334,895 | $230,933 | $103,962 |
| 2018 | $4,549 | $328,329 | $226,405 | $101,924 |
| 2016 | $4,373 | $315,581 | $217,614 | $97,967 |
| 2015 | $4,279 | $310,842 | $214,346 | $96,496 |
| 2014 | $4,241 | $304,754 | $210,148 | $94,606 |
Source: Public Records
Map
Nearby Homes
- 228 Oaks Ave
- 143 W Greystone Ave
- 347 Stedman Place
- 319 N Encinitas Ave
- 137 N Myrtle Ave
- 210 N Encinitas Ave
- 245 W Scenic Dr
- 267 Linwood Ave Unit E
- 113 N Ivy Ave
- 128 N Ivy Ave
- 334 Linwood Ave
- 239 W Palm Ave
- 375 N Canyon Blvd
- 425 N Canyon Blvd
- 105 S Mayflower Ave Unit E
- 309 S Alta Vista Ave
- 537 Cloverleaf Dr
- 516 Linwood Ave
- 210 W Lime Ave
- 426 N Canyon Blvd
- 216 Monroe Place
- 226 Monroe Place
- 240 Monroe Place
- 234 Monroe Place
- 204 Monroe Place
- 236 Monroe Place
- 217 Oaks Ave
- 223 Oaks Ave
- 211 Oaks Ave
- 202 Monroe Place
- 241 N Primrose Ave
- 238 Monroe Place
- 215 Monroe Place
- 229 Oaks Ave
- 231 N Primrose Ave
- 231 N Primrose Ave
- 225 Monroe Place
- 209 Monroe Place
- 227 Monroe Place
- 235 Oaks Ave
Your Personal Tour Guide
Ask me questions while you tour the home.