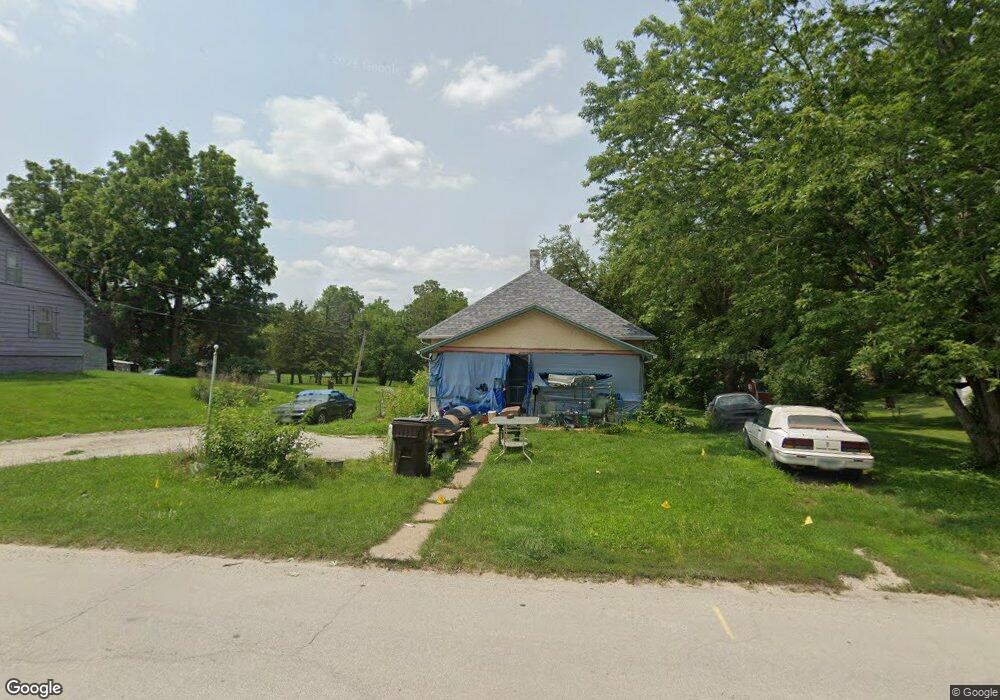
220 N Fillmore St Osceola, IA 50213
Estimated Value: $99,000 - $162,000
3
Beds
1
Bath
1,112
Sq Ft
$118/Sq Ft
Est. Value
About This Home
This home is located at 220 N Fillmore St, Osceola, IA 50213 and is currently estimated at $131,125, approximately $117 per square foot. 220 N Fillmore St is a home located in Clarke County with nearby schools including Clarke Community Elementary School, Clarke Middle School, and Clarke Community High School.
Ownership History
Date
Name
Owned For
Owner Type
Purchase Details
Closed on
Apr 20, 2009
Sold by
Swine Graphics Enterprises Lp
Bought by
Potter Elsie M
Current Estimated Value
Home Financials for this Owner
Home Financials are based on the most recent Mortgage that was taken out on this home.
Original Mortgage
$49,470
Interest Rate
4.92%
Mortgage Type
New Conventional
Purchase Details
Closed on
Mar 23, 2009
Sold by
Mcclallen Steven L and Mcclallen Martha
Bought by
Tapscott Donna
Home Financials for this Owner
Home Financials are based on the most recent Mortgage that was taken out on this home.
Original Mortgage
$49,470
Interest Rate
4.92%
Mortgage Type
New Conventional
Create a Home Valuation Report for This Property
The Home Valuation Report is an in-depth analysis detailing your home's value as well as a comparison with similar homes in the area
Home Values in the Area
Average Home Value in this Area
Purchase History
| Date | Buyer | Sale Price | Title Company |
|---|---|---|---|
| Potter Elsie M | $48,500 | None Available | |
| Tapscott Donna | $92,500 | None Available |
Source: Public Records
Mortgage History
| Date | Status | Borrower | Loan Amount |
|---|---|---|---|
| Previous Owner | Potter Elsie M | $49,470 |
Source: Public Records
Tax History Compared to Growth
Tax History
| Year | Tax Paid | Tax Assessment Tax Assessment Total Assessment is a certain percentage of the fair market value that is determined by local assessors to be the total taxable value of land and additions on the property. | Land | Improvement |
|---|---|---|---|---|
| 2024 | $1,752 | $83,220 | $24,980 | $58,240 |
| 2023 | $1,130 | $83,220 | $24,980 | $58,240 |
| 2022 | $1,680 | $74,370 | $21,230 | $53,140 |
| 2021 | $1,506 | $62,360 | $17,800 | $44,560 |
| 2020 | $1,466 | $62,360 | $17,800 | $44,560 |
| 2019 | $1,520 | $62,360 | $0 | $0 |
| 2018 | $1,476 | $62,360 | $0 | $0 |
| 2017 | $1,476 | $57,210 | $0 | $0 |
| 2016 | $1,400 | $57,210 | $0 | $0 |
| 2014 | $1,348 | $53,160 | $0 | $0 |
Source: Public Records
Map
Nearby Homes
- 215 W Clay St
- 321 W Clay St
- 128 W Logan St
- 213 W Logan St
- 215 N Lincoln St
- 131 N Park St
- 101 N Lincoln St
- 119 N Park St
- 601 N Main St
- 127 W Garfield St
- 117 W Logan St
- 214 W Jefferson St
- 213 N Adams St
- 220 Eastside Dr
- 301 E Washington St
- 322 S Temple St
- 115 W Mclane St
- 420 W Mclane St
- 116 W Grant St
- 114 E Grant St
- 210 N Fillmore St
- 211 N Fillmore St
- 215 N Fillmore St
- 217 N Fillmore St
- 206 N Fillmore St
- 214 W Clay St
- 200 W Clay St
- 200 N Fillmore St
- 201 N Fillmore St
- 130 W Clay St
- 122 W Clay St
- 216 W Clay St
- 207 W Clay St
- 220 W Clay St
- 222 W Clay St
- 306 N Fillmore St
- 209 N Jackson St
- 117 W Clay St
- 216 W Webster St