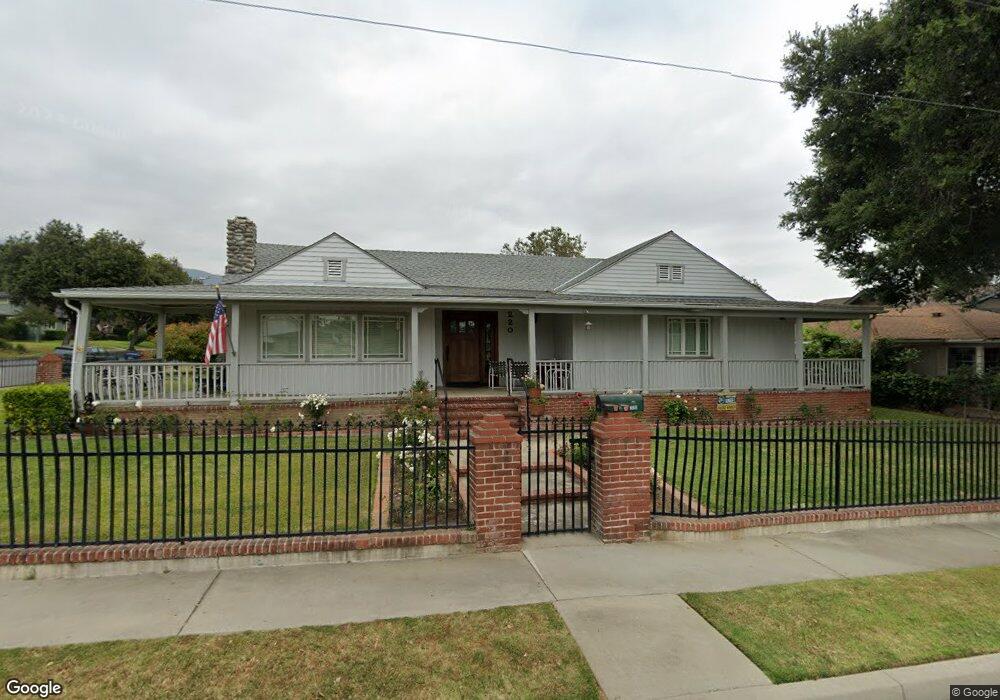
220 N Magnolia Ave Monrovia, CA 91016
Estimated Value: $1,353,000 - $1,675,779
4
Beds
3
Baths
3,184
Sq Ft
$491/Sq Ft
Est. Value
About This Home
This home is located at 220 N Magnolia Ave, Monrovia, CA 91016 and is currently estimated at $1,564,445, approximately $491 per square foot. 220 N Magnolia Ave is a home located in Los Angeles County with nearby schools including Mayflower Elementary School, Clifton Middle School, and Monrovia High School.
Ownership History
Date
Name
Owned For
Owner Type
Purchase Details
Closed on
Sep 5, 1997
Sold by
Ewing Walter L
Bought by
Ewing Walter Lee and Ewing Lucena A
Current Estimated Value
Purchase Details
Closed on
Nov 7, 1995
Sold by
Home Svgs Of America Fsb
Bought by
Ewing Walter L and Ewing Lucena A
Home Financials for this Owner
Home Financials are based on the most recent Mortgage that was taken out on this home.
Original Mortgage
$122,400
Outstanding Balance
$1,683
Interest Rate
7.42%
Mortgage Type
Seller Take Back
Estimated Equity
$1,562,762
Purchase Details
Closed on
Feb 16, 1995
Sold by
Home Svgs Of America Fsb
Bought by
Ewing Walter L and Ewing Lucena A
Home Financials for this Owner
Home Financials are based on the most recent Mortgage that was taken out on this home.
Original Mortgage
$138,000
Interest Rate
9.23%
Mortgage Type
Seller Take Back
Create a Home Valuation Report for This Property
The Home Valuation Report is an in-depth analysis detailing your home's value as well as a comparison with similar homes in the area
Home Values in the Area
Average Home Value in this Area
Purchase History
| Date | Buyer | Sale Price | Title Company |
|---|---|---|---|
| Ewing Walter Lee | -- | -- | |
| Ewing Walter L | $153,000 | Stewart Title | |
| Ewing Walter L | $172,500 | Southland Title |
Source: Public Records
Mortgage History
| Date | Status | Borrower | Loan Amount |
|---|---|---|---|
| Open | Ewing Walter L | $122,400 | |
| Previous Owner | Ewing Walter L | $138,000 |
Source: Public Records
Tax History Compared to Growth
Tax History
| Year | Tax Paid | Tax Assessment Tax Assessment Total Assessment is a certain percentage of the fair market value that is determined by local assessors to be the total taxable value of land and additions on the property. | Land | Improvement |
|---|---|---|---|---|
| 2025 | $5,345 | $364,031 | $124,773 | $239,258 |
| 2024 | $5,345 | $356,894 | $122,327 | $234,567 |
| 2023 | $5,230 | $349,897 | $119,929 | $229,968 |
| 2022 | $5,086 | $343,037 | $117,578 | $225,459 |
| 2021 | $4,975 | $336,312 | $115,273 | $221,039 |
| 2019 | $4,755 | $326,339 | $111,855 | $214,484 |
| 2018 | $4,496 | $319,941 | $109,662 | $210,279 |
| 2016 | $4,295 | $307,518 | $105,404 | $202,114 |
| 2015 | $4,204 | $302,900 | $103,821 | $199,079 |
| 2014 | $4,170 | $296,968 | $101,788 | $195,180 |
Source: Public Records
Map
Nearby Homes
- 220 W Hillcrest Blvd
- 347 Stedman Place
- 208 Highland Place
- 453 N Alta Vista Ave
- 550 W Foothill Blvd Unit C
- 314 May Ave
- 516 Linwood Ave
- 235 E Foothill Blvd Unit B
- 733 Crescent Dr
- 116 N Canyon Blvd
- 375 N Canyon Blvd
- 425 N Canyon Blvd
- 803 Crescent Dr
- 171 N Sunset Place
- 411 Sierra Vista Ave
- 221 Violet Ave Unit A
- 430 N Canyon Blvd
- 214 Fowler Dr
- 277 Aspen Dr
- 846 W Hillcrest Blvd
- 236 Oaks Ave
- 210 N Magnolia Ave
- 228 N Magnolia Ave
- 209 Acacia Ave
- 228 Oaks Ave
- 217 N Magnolia Ave
- 221 N Magnolia Ave
- 239 Oaks Ave
- 202 N Magnolia Ave
- 205 Acacia Ave
- 235 Oaks Ave
- 225 N Magnolia Ave
- 234 N Magnolia Ave
- 211 N Magnolia Ave
- 201 Acacia Ave
- 229 Oaks Ave
- 229 N Magnolia Ave
- 180 N Magnolia Ave
- 201 N Magnolia Ave
- 233 N Magnolia Ave